客服热线:
 手机版
 二维码






























EFC Indicator
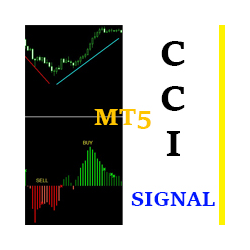
The unique EFC indicator is designed to determine the end of a trend which will then break to a trend reversal. It uses a combination of the RSI indicator and divergence to show you this. The indicator can determine entry points on any trading period from M1 to MN. For easy user experience, the indicator renders an entry point (in the form of a up or down arrow), with a recommended take profit and stop loss level.
Features
- Color of the items can be customized
- Draw mode can be set to different customized settings based on user preference
- Trading alerts will trigger based on strategy
- Risk to Reward can be adjusted to user preference (Default Risk: Reward is 1:3)
- Stop loss adjustment
- Range of scanning bars can be adjusted (Default of 50)
Parameters
- Range of scanning, bars: Since the indicator works in real-time mode and helps to analyze current situation, it needs some history to look in to find RSI pattern. Usually, range about 50-100 bars is completely enough to detect trade pattern
- RSI parameters
- Period: Period of standard RSI indicator, which is used for pattern recognition
- Applied price: Price to which RSI indicator is applied
- Overbought/oversold levels: By default, 80/20 values are used to detect when market reached the reversal point. You can tighten the conditions and vice versa to mitigate them, if you think the market needs it
- Stop loss/take profit settings
- Stop loss margin, points: Stop loss level is calculated by using lowest colored candle (BUY trade) or highest colored candle (SELL trade) in the pattern. By default, it is placed right on the high/low value. But you can adjust it, moving the SL farther or nearer with this parameter
- Risk:Reward (1:X): Take profit is calculated automatically by stop loss distance and by this ratio. Let’s say if your Risk:Reward ratio is 1:3 and your stop loss is 100 points, your take profit will be 100*3=300 points. Changing this parameter you can vary how much profit you’re going to have from each trade
- Drawing settings
- Draw mode: After trade signal generation EFC indicator follows an imaginary trade until take profit/stop loss is hit or new signal is generated. To visualize we’re in trade we can use several drawing styles
- Colored bars (red for short position, green for long position) from low to high.
- Colored bars from open to close
- Bricks above/below candle
- Candle width: By default, bars involved in trade are painted atop of chart bars/candles with the same width, but you can change their width if you’re willing to
- Lookback line/Buy signal/Sell signal/Stop loss/Take profit colors: Each type of drawings indicator makes can be adjusted to the color you like.


本店最新上架
-
- MT4 MT5跟单EA 本地跟单远程跟单 绝不

- ¥1100.00
-
- 在MetaTrader市场购买MetaTrader 5的&#
- ¥3988.00
-
- 在MetaTrader市场购买MetaTrader 5的&#
- ¥3988.00
-
- 在MetaTrader市场购买MetaTrader 5的&#
- ¥3988.00
-
- 在MetaTrader市场购买MetaTrader 5的&#

- ¥3988.00
全网为您推荐
-
- AlgoTradeSoft

- ¥3988.00
-
- 国际期货套利软件
- ¥3988.00
-
- MT4 MT5跟单EA 本地跟单远程跟单 绝不
- ¥1100.00
-
- 在MetaTrader市场购买MetaTrader 5的&#
- ¥3988.00
-
- 在MetaTrader市场购买MetaTrader 5的&#
- ¥3988.00