 客服热线:
 手机版
 二维码




































Bollinger R
The Bollinger R (Bollinger Reversals) is designed to recognize short term high profitable counter trend patterns from the chart. This system combines both Bollinger Bands and mean reversion to define positions where the market could potentially reverse direction.
Description
Bollinger Bands are well known in the trading community. General concept with Bollinger method is selling when the price touches the upper band and buying when the price touches the lower band. Even though it works perfectly in technical, in real case scenario, this will fail if there are strong trends. To overcome this situation, I have added the concepts mean reversion and "distance between Price and a Moving Average" to help confirm and trade the “bounce” of an upper or a lower band. The system will be more powerful when we use Bollinger Bands with mean reversion System.
Mean reversion trading is often referred to as counter-trend or reversal trading.
A mean reversion trader is looking for opportunities where price has moved away from its average (or mean) price significantly. Usually, the mean price is calculated by using a moving average. Price frequently pulls away from the moving average and then snaps right back to it. This is the one of the common pattern occurring in the market.
Bollinger R is the only indicator that shows trading signals ahead of time! So Bollinger method with reversion system will return great results.
Features
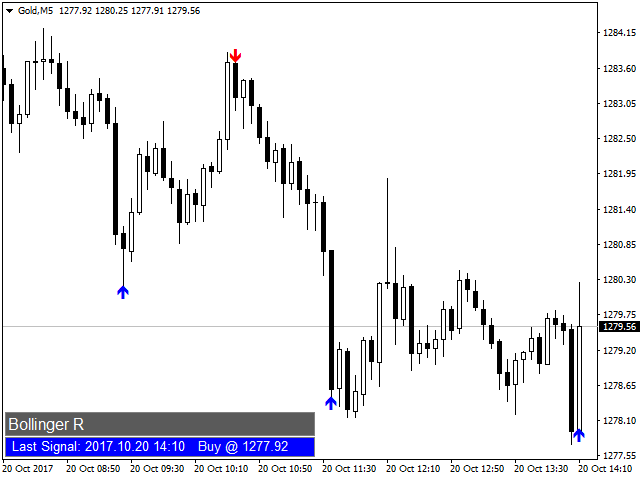
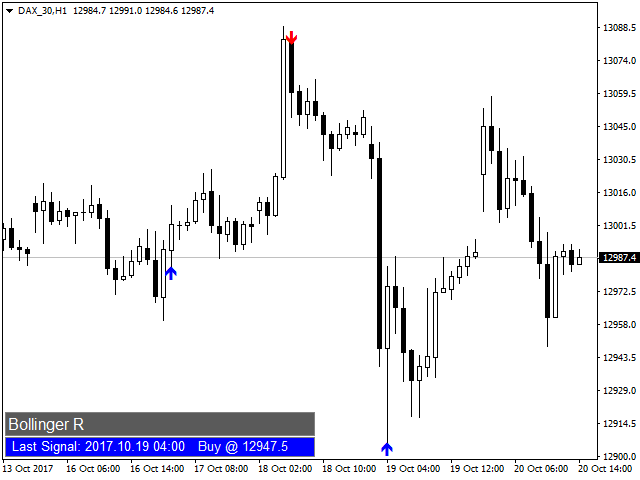
This indicator does not repaint and never changes signals in the history. For all you can see in the history, the indicator will show exactly the same in real time. The indicator does not wait on the reaction of a new candle, but shows the signal (arrow) immediately on the opening of candles. It works on any instrument and any time frame.
Key technical indicators used – Moving average, Bollinger bands, Standard Deviation and Price Channel.
Signal Dashboard - To make the indicator more user friendly, I have added a signal dash board which gives you an idea about when the last signal occurred and what was the action suggested without referencing back (scrolling/moving back) the chart. You can hide or unhide this feature easily using true or false values in the input settings.
How to trade with Bollinger R
The trading signals of Bollinger R System are clear and easy to trade! The indicator is useful for beginners as well as professional traders. As soon as the new candle opens and the indicator draws an arrow, it means there is an opportunity that the market will go in the direction of the arrow. So trader can act immediately.
Statistics
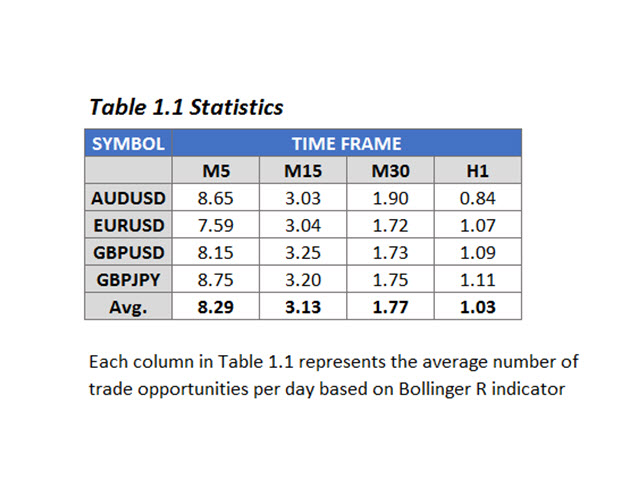
While checking historical performance of Bollinger R indicator, you will get an average of 8.29 signals per symbol on M5 time frame for a day. Similarly, with M15 is 3.13, M30 is 1.77 and H1 is 1.03.
Input parameters
- Bands Period - Default: 20
- Bands Deviations - Default: 2.0
- Dashboard - True/False
- alerts - True/False
- Arrow color – Default: For buy – Blue, For sell – Red. (You can select any color from the drop down list).



本店最新上架
-
- MT4 MT5跟单EA 本地跟单远程跟单 绝不

- ¥1100.00
-
- 在MetaTrader市场购买MetaTrader 5的&#

- ¥3988.00
-
- 在MetaTrader市场购买MetaTrader 5的&#

- ¥3988.00
-
- 在MetaTrader市场购买MetaTrader 5的&#

- ¥3988.00
-
- 在MetaTrader市场购买MetaTrader 5的&#

- ¥3988.00
全网为您推荐
-
- AlgoTradeSoft

- ¥3988.00
-
- 国际期货套利软件

- ¥3988.00
-
- MT4 MT5跟单EA 本地跟单远程跟单 绝不
- ¥1100.00
-
- 在MetaTrader市场购买MetaTrader 5的&#
- ¥3988.00
-
- 在MetaTrader市场购买MetaTrader 5的&#
- ¥3988.00


