客服热线:
 手机版
 二维码


































McDuck Indicator
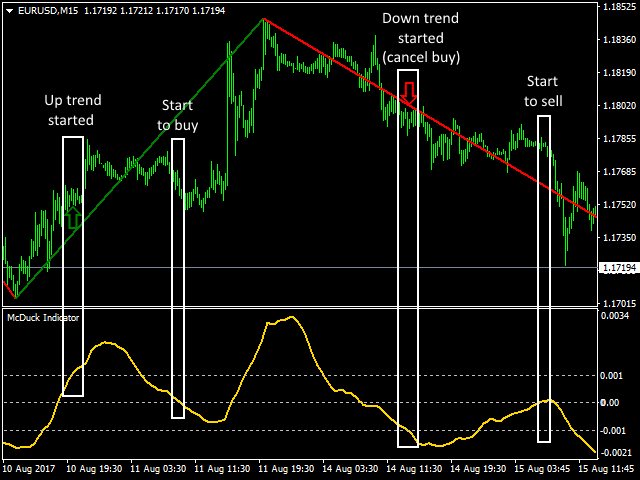
The McDuck Indicator help determine the trend direction and find the point to open a position.
The indicator displays trends as lines on the price chart, connecting their extremes (Highs and Lows). The green line shows that an uptrend is currently present, and connects the Low of the previous downtrend with the High of the current uptrend. The red line indicates a downtrend on the market and connects the High of the previous uptrend with the Low of the current downtrend. Green and red arrows show the starting points of the ascending (green arrow) and the descending (red arrow) trends.
An oscillator based on the standard MACD technical indicator is displayed below the price chart in a separate window. The oscillator has three windows: 0 - zero base level; and two (equal in value and opposite in sign) levels for determining the impulses.
Settings
- FastSMAPeriod - period of the fast moving average used in the indicator's calculations.
- SlowSMAPeriod - period of the slow moving average used in the indicator's calculations.
- ImpulseLevel - impulse level of the indicator, at which the oscillator line detects the presence of an impulse.
How to Use
Conditions for buying: 1) a green up arrow formed on the price chart; 2) a green trend line appeared, which connects the Low of the previous downtrend and the High of the current; 3) in the subwindow, the oscillator line rose above the positive value of ImpulseLevel. All this indicates the beginning of an uptrend, and it is possible to look for entry points to buy. 4) As soon as the oscillator value falls below the base level of 0, start buying. The start of a downtrend will serve as the signal to exit buy trades.
Conditions for selling: 1) a red up arrow formed on the price chart; 2) a red trend line appeared, which connects the High of the previous uptrend and the Low of the current; 3) in the subwindow, the oscillator line fell below the negative value of ImpulseLevel. All this indicates the beginning of a downtrend, and it is possible to look for entry points to sell. 4) As soon as the oscillator value rises above the base level of 0, start selling. The start of an uptrend will serve as the signal to exit sell trades.
本店最新上架
-
- MT4 MT5跟单EA 本地跟单远程跟单 绝不

- ¥1100.00
-
- 在MetaTrader市场购买MetaTrader 5的&#
- ¥3988.00
-
- 在MetaTrader市场购买MetaTrader 5的&#

- ¥3988.00
-
- 在MetaTrader市场购买MetaTrader 5的&#
- ¥3988.00
-
- 在MetaTrader市场购买MetaTrader 5的&#

- ¥3988.00
全网为您推荐
-
- AlgoTradeSoft

- ¥3988.00
-
- 国际期货套利软件

- ¥3988.00
-
- MT4 MT5跟单EA 本地跟单远程跟单 绝不
- ¥1100.00
-
- 在MetaTrader市场购买MetaTrader 5的&#
- ¥3988.00
-
- 在MetaTrader市场购买MetaTrader 5的&#
- ¥3988.00