 客服热线:
 手机版
 二维码




































GeoWprPro
WPR by Profile, or WPR for Professionals
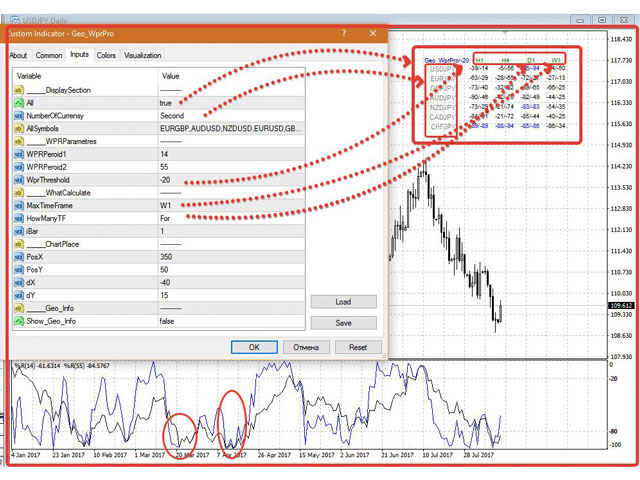
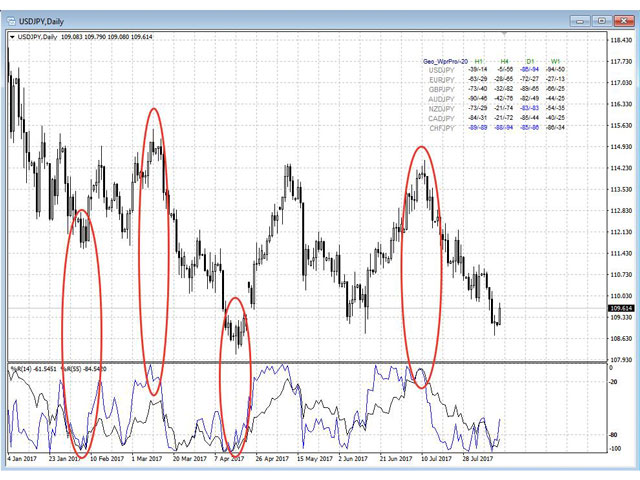
- Geo_WprPro is one of the well-known currency profile indicators. It simultaneously displays two WPR indicators with different parameters in the matrix form on all timeframes of multiple currency pairs forming the currency profile.
- As follows from the description, "WPR is a leading indicator that often goes ahead of the price chart. The oscillator frequently reaches extreme values before the price reversal as if anticipating that event: it almost always forms a High and turns down a few days before the price reaches the High and turns down, and vice versa".
- Thus, you can see if the selected instrument and other currency pairs with this instrument are ready for reversal, without switching timeframes, while tracking two indicators with different calculation periods simultaneously allows you to understand the price intentions both in the immediate and distant future.
- The indicator is perfect for scalpers, intraday and medium-term traders since it features an excellent market entry accuracy based on the synthesis of signals from different timeframes and other currency pairs.
- If the indicator lines go beyond the threshold values (-20/-80), the font color changes to blue/red accordingly signaling of a possible reversal. The threshold value can be changed in the parameters.
- If the signals from different timeframes and along the entire currency profile match each other, the signal is amplified considerably.
- The indicator also shows the upcoming market entry opportunity.
- Since the indicator displays and analyzes the instrument profile (simultaneous display of a selected instrument on various pairs), the indicator works with a set of currency pairs the instrument profile can be compiled of. All instruments that should be used to build a profile are set the same way as in the "Market Watch" in the AllSymbols input (comma separated, no spaces). The list can be changed/added by a user.
Parameters
Display Section - how to display
- ALL - display as a matrix (True) or only for one instrument as a line (False).
- NumberOfCurrensy - First or Second - select currency in a pair the profile is built for (First/Second).
- AllSymbols = "EURGBP, AUDUSD, NZDUSD, EURUSD, GBPUSD, USDJPY, USDCAD, USDCHF, EURJPY, EURCAD, EURCHF, GBPJPY, GBPCAD, GBPCHF, AUDJPY, NZDJPY, AUDCAD, AUDCHF, NZDCAD, NZDCHF, CADJPY, CADCHF, CHFJPY, AUDNZD, EURAUD, GBPAUD, EURNZD, GBPNZD, XAUUSD, XAUEUR, XAUAUD, XAUGBP, XAUCHF, EURPLN"; - list of all symbols participating in building the profile.
WPRParametres - WPR parameters
- WPRPeriod1 - first indicator period.
- WPRPeriod2 - second indicator period.
- WprThreshold - threshold for changing color for overbought/oversold conditions (usually -20).
WhatCalculate - what to calculate
- MaxTimeframe - maximum timeframe, on which the calculation is performed and which is to be displayed (M1, M5, M15, M30, H1, H4, D1, W1, MN)
- HowManyTF - how many timeframes are to be calculated and displayed (starting with the highest one set in MaxTimeframe).
- iBar - bar index for calculation, = 0 - current bar, =1 - closed bar. The values of 2, 3, etc. can be used to display with a shift to the appropriate number of bars back into history. I use 1.
ChartPlace - matrix location parameters.
- PosX - X coordinate for locating the matrix on the chart. I use 350.
- PosY - Y coordinate for locating the matrix on the chart. I use 50. The matrix is placed in the upper right corner of the chart.
- dX - distance between columns.
- dY - distance between rows.
Geo_Info - display main data on a symbol like in the Geo_Info indicator.
- Show_Geo_Info - True or False - display main data on the instrument in the left corner as a line, like in Geo_Info.
本店最新上架
-
- MT4 MT5跟单EA 本地跟单远程跟单 绝不

- ¥1100.00
-
- 在MetaTrader市场购买MetaTrader 5的&#

- ¥3988.00
-
- 在MetaTrader市场购买MetaTrader 5的&#

- ¥3988.00
-
- 在MetaTrader市场购买MetaTrader 5的&#

- ¥3988.00
-
- 在MetaTrader市场购买MetaTrader 5的&#

- ¥3988.00
全网为您推荐
-
- AlgoTradeSoft

- ¥3988.00
-
- 国际期货套利软件

- ¥3988.00
-
- MT4 MT5跟单EA 本地跟单远程跟单 绝不
- ¥1100.00
-
- 在MetaTrader市场购买MetaTrader 5的&#
- ¥3988.00
-
- 在MetaTrader市场购买MetaTrader 5的&#
- ¥3988.00


