客服热线:
 手机版
 二维码
































Three Line Break
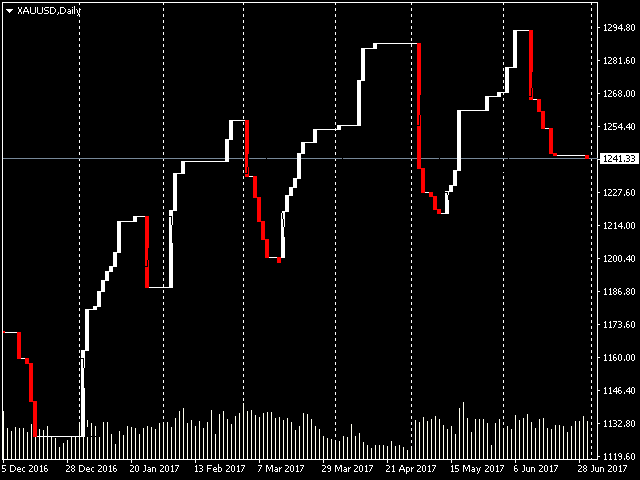
This is another implementation of a Japanese traditional trading chart known as Three Line Break chart. These charts ignore time and only change when prices move a certain amount. In this regard, these charts are quite similar to Point & Figure charts. Three Line Break charts show a series of vertical white and red (or Black) lines. White lines represent rising prices, while red lines portray falling prices. Prices continue in the same direction until a reversal is warranted. A reversal occurs when the closing price exceeds the high or low of the prior three lines.
Here this chart is implemented as an indicator not in a separate window, but in the data chart itself. After inserting this indicator on your chart it is recommended you turn off your chart view by changing to line chart view and setting the color for the line graphs as something like None or Black. You can find more about this chart in Steve Nison book of `Beyond Candlesticks`. There is only one parameter to this indicator.
Parameters
- dp (double >= 0.0) as tolerance to filter noise in drawing new lines, see Tips below.
Tips for selecting dp
First select dp = 0.0 and watch your chart. There will be some white lines between a series of red lines, and vise versa some red lines inside white lines. We call these sudden lines as noise. To reduce noise you should increase the value of dp. But be aware if you increase it so much then this indicator prints an error that can not initialize properly with this dp value.
For daily Gold charts you can use dp = 1.1 as an example.
本店最新上架
-
- MT4 MT5跟单EA 本地跟单远程跟单 绝不

- ¥1100.00
-
- 在MetaTrader市场购买MetaTrader 5的&#
- ¥3988.00
-
- 在MetaTrader市场购买MetaTrader 5的&#
- ¥3988.00
-
- 在MetaTrader市场购买MetaTrader 5的&#
- ¥3988.00
-
- 在MetaTrader市场购买MetaTrader 5的&#

- ¥3988.00
全网为您推荐
-
- AlgoTradeSoft

- ¥3988.00
-
- 国际期货套利软件

- ¥3988.00
-
- MT4 MT5跟单EA 本地跟单远程跟单 绝不
- ¥1100.00
-
- 在MetaTrader市场购买MetaTrader 5的&#
- ¥3988.00
-
- 在MetaTrader市场购买MetaTrader 5的&#
- ¥3988.00