 客服热线:
 手机版
 二维码




































RSI Trend
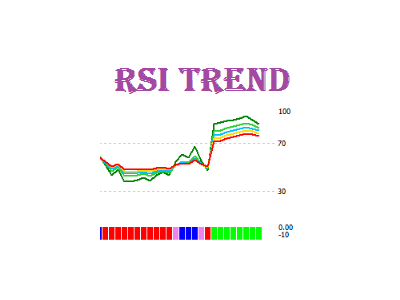
RSI Trend is a trend indicator that interprets the current market situation based on multiple RSI indicators with different periods.
Indicator Benefits
- Displays zones of an evident trend movement, overbought/oversold zones, as well as transition zones;
- Can be used in scalping strategies, as well as medium-term and long-term strategies;
- Has a minimum of settings;
- The standard line colors and selected for a comfortable operation with the black and white styles of the chart;
- Can be used in Expert Advisors
Input Variables explained
- Period - the average line period of the RSI indicator.
Description of indicator
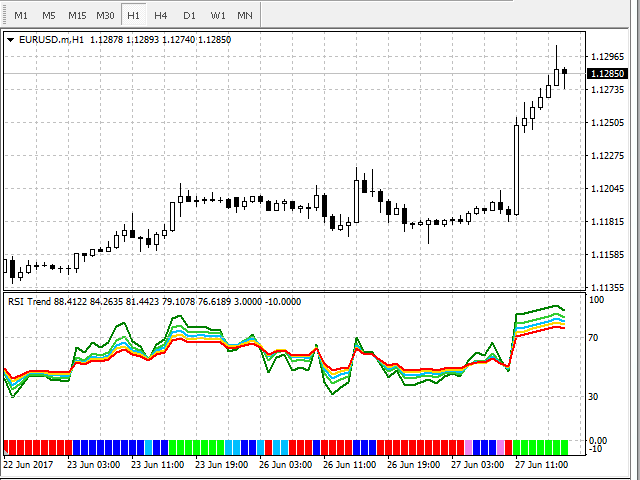
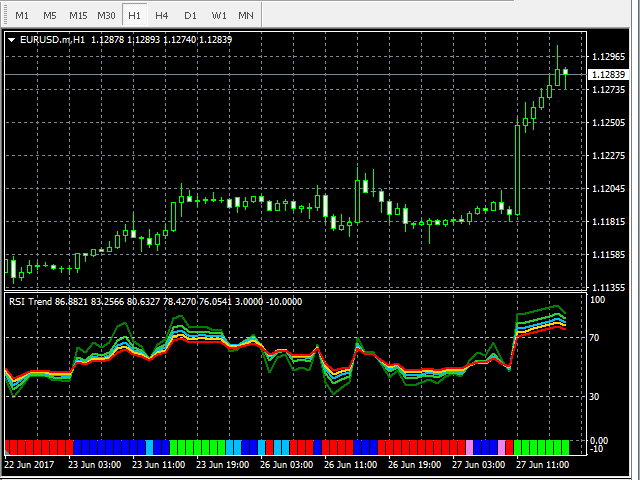
The indicator consists of RSI 5 lines with different periods and colored histograms on each candlestick, interpreting the market situation. In settings, you specify the period of the average RSI line, while the periods of other lines will be calculated automatically. Depending on the sequence of RSI lines, there 6 possible market situations, which are displayed on the chart as a histogram of different colors.
Histograms can be of 6 different colors:
- Green - overbought zone;
- Blue - upward trend;
- Light blue - the price is too low;
- Pink - the price is too high;
- Red - downward trend;
- Orange - oversold zone.
Zones of upward/downward trend movement.
The overbought/oversold zones occur after trend movements, indicating a decrease in the trend strength, further correction or trend reversal.
Zones with a too high/low price appear as a result of a sharp price movement against the trend, followed by either a price return to the current trend, or an attempt to form a new trend.
Using in an Expert Advisor
For convenient indicator use in the Expert Advisors, it has a buffer (buffer index "5") containing all the values of the histograms:
- "3" - green - overbought zone;
- "2" - blue - upward trend;
- "1" - light blue - the price is too low;
- "-1" - pink - the price is too high;
- "-2" - red - downward trend;
- "-3" - orange - oversold zone;
- "EMPTY_VALUE" - an empty valye, uncalculated bars.
Please contact me for any questions and suggestions.

本店最新上架
-
- MT4 MT5跟单EA 本地跟单远程跟单 绝不

- ¥1100.00
-
- 在MetaTrader市场购买MetaTrader 5的&#

- ¥3988.00
-
- 在MetaTrader市场购买MetaTrader 5的&#

- ¥3988.00
-
- 在MetaTrader市场购买MetaTrader 5的&#

- ¥3988.00
-
- 在MetaTrader市场购买MetaTrader 5的&#

- ¥3988.00
全网为您推荐
-
- AlgoTradeSoft

- ¥3988.00
-
- 国际期货套利软件

- ¥3988.00
-
- MT4 MT5跟单EA 本地跟单远程跟单 绝不
- ¥1100.00
-
- 在MetaTrader市场购买MetaTrader 5的&#
- ¥3988.00
-
- 在MetaTrader市场购买MetaTrader 5的&#
- ¥3988.00


