 客服热线:
 手机版
 二维码






















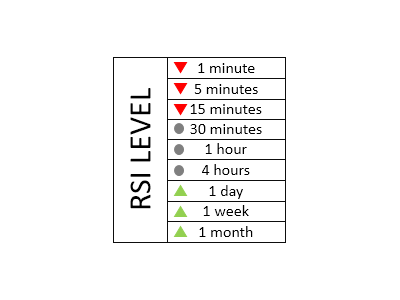














Multitimeframe RSI Monitor
The indicator Multitimeframe RSI Monitor shows the Relative Strenght index(RSI) status in every timeframe of metatrader 4, according to your selected Overbought and Oversold levels. The triangle pointing up indicates an oversold level, the triangle pointing down indicates an overbought level and the circle indicates a neutral level.
Input parameters
- RSI period: Period for RSI calculation.
- RSI Applied Price: Price for the RSI calculation.
- Overbought Level: You customize you own Overbought Level
- Oversold Level: You customize you own Oversold Level
- Title Color: Title color
- Text Color: Text color (Timeframe labels)
- Overbought triangle color: Overbought triangle color
- Oversold triangle color: Oversold triangle color
- Neutral color: Circle color for neutral levels
- Background color: Backgroung color
- Show in this corner: Select the place to show the information


本店最新上架
-
- MT4 MT5跟单EA 本地跟单远程跟单 绝不

- ¥1100.00
-
- 在MetaTrader市场购买MetaTrader 5的&#

- ¥3988.00
-
- 在MetaTrader市场购买MetaTrader 5的&#

- ¥3988.00
-
- 在MetaTrader市场购买MetaTrader 5的&#

- ¥3988.00
-
- 在MetaTrader市场购买MetaTrader 5的&#

- ¥3988.00
全网为您推荐
-
- AlgoTradeSoft

- ¥3988.00
-
- 国际期货套利软件

- ¥3988.00
-
- MT4 MT5跟单EA 本地跟单远程跟单 绝不
- ¥1100.00
-
- 在MetaTrader市场购买MetaTrader 5的&#
- ¥3988.00
-
- 在MetaTrader市场购买MetaTrader 5的&#
- ¥3988.00


