 客服热线:
 手机版
 二维码





































Super Custom Indicator
Super Custom Indicator allows you to design trading signals on your own without coding knowledge. You just need to input the trading rules and it will scan multiple symbols at multiple time frames to find the signals for you in real-time as well as in history chart. Real-time signals will be sent to your mobile and email also.
The indicator can calculate and analyze every technical indicators, even custom indicators, with complex operations to give the signal exactly.
Normally, it is hard for you to monitor signals of few symbols on few time frames at the same time. But now, you only need one chart with this indicator. It will monitor everything for you with just a neat table. This will save your time and effort in trading.
Furthermore, with this indicator you can test quickly every strategies you find and know if it's good or not just in minutes.
Input Setting Parameters
-
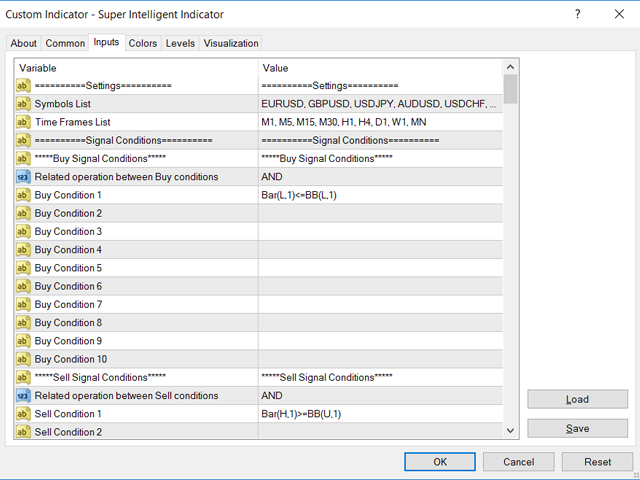
Common Settings: This is where to setup the parameters for symbols and time frames.
Symbol List: List of all symbols that you want to find the signal with. The symbols can be separated by comma (,) or semicolon (;). If you leave it blank, the indicator will take the symbol of current chart.
Time frames List: List of all time frames that you want to find the signal with. The time frames can be separated by coma (,) or semicolon (;). If you leave it blank, the indicator will take the current time frame of current chart.
-
Signal Conditions/Rules: This is where to setup the trading conditions/rules for your strategy. You can add up to 10 different conditions/rules for Buy and Sell signals. Please note that the default signal condition is just an example, it's not necessary that it's a winning signal.
Related operation between Buy/Sell conditions: You can combine conditions by a related operation, either AND or OR.
Conditions: This is the most important part of this indicator. It determines how the signals will be shown. You must write your strategy's entry conditions/rules here. Elements in the conditions can be value of any technical indicator, candlestick/bar's price or any number. They must be written strictly follow the syntax format, which is instructed in the manual guide attached in the comment section.
-
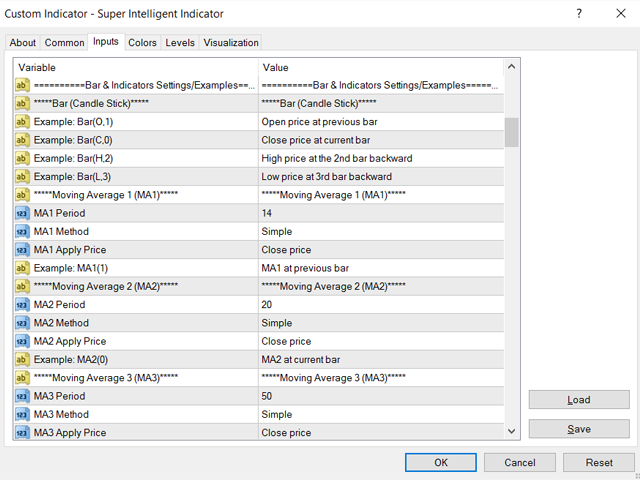
Bar & Indicators Settings/Examples: This is where to setup the parameters applied for technical indicators. You can find every built-in technical indicators and even custom indicator here. There are examples of how to call the bars/indicators in the signal condition.
-
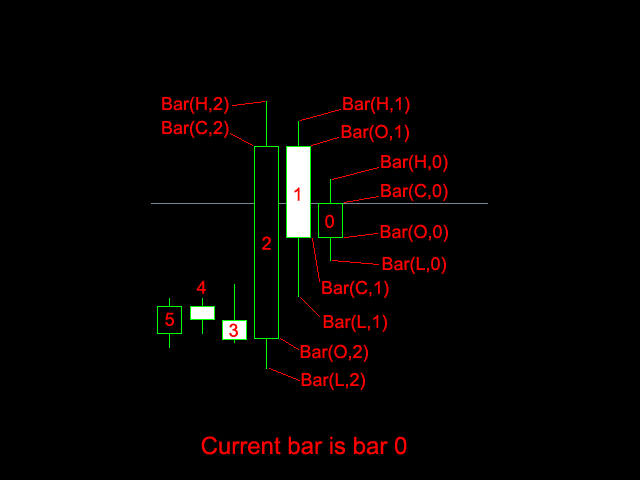
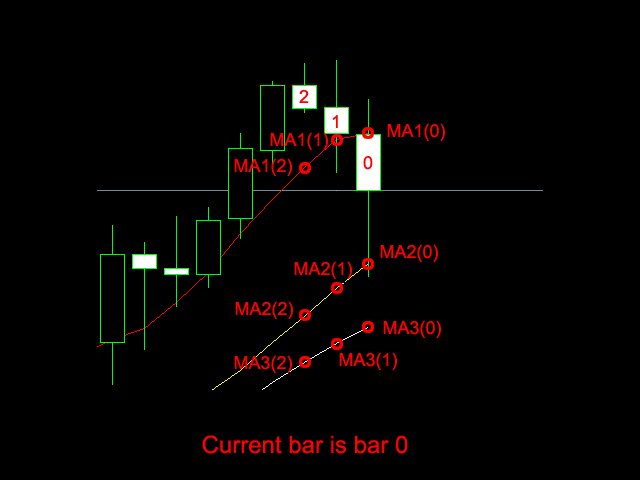
Bar/Candle Stick Price: Call the price of an element of a bar/candlestick at a specific shift on the chart.
- Open Price: Bar(O,x).
- Close Price: Bar(C,x).
- High Price (Upper shadow/wick): Bar(H,x).
- Low Price (Lower shadow/wick): Bar(L,x).
In which, x is the bar-shift backward from the current bar. Current bar shift is 0.
Moving Average (MA): Call the moving average price at a specific bar on the chart. You can call up to 3 different MAs in case there are multiple MAs in your strategy. Example: MA1(x), MA2(x), MA3(x).
...: (See more indicator instructions in the manual guide posted in comment area).
-
alertSettings: This is where to setup the alert options when a signal appear.
InterfaceSettings: This is where to setup the interface options for the indicator, such as font size, color of arrows, color of table, size of table, etc...
Usage
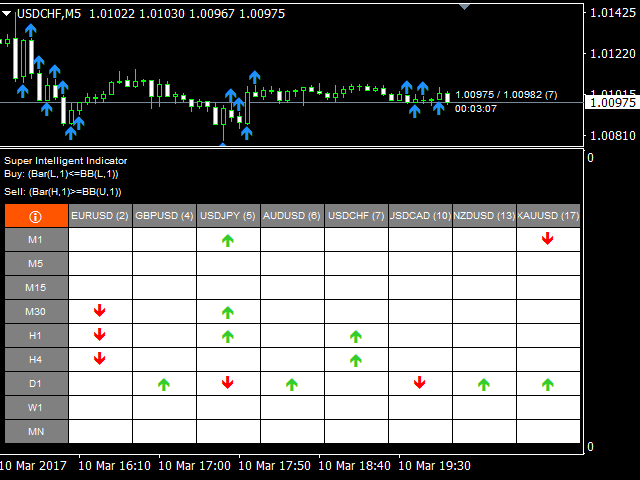
After installed the indicator on your chart, it will show up in a separated window. The top-row of the table will show all listed symbols and the left side-column will show all listed time frames.
If there is any Buy/Sell signal that meet the defined conditions at the moment (current bar), it will show an Up/Down arrow at the corresponding cell of the table.
You can click to any cell to jump to corresponding symbol and time frame.
At the same time, you can check all history signals of the symbol on current timeframe of the current chart. The open price of the candle that the arrow appear is where the signal /confirm/ied.
To Users
Please contact me if you need any help in writing your strategy. All ideas about good signals are welcome to share here.

本店最新上架
-
- MT4 MT5跟单EA 本地跟单远程跟单 绝不

- ¥1100.00
-
- 在MetaTrader市场购买MetaTrader 5的&#

- ¥3988.00
-
- 在MetaTrader市场购买MetaTrader 5的&#

- ¥3988.00
-
- 在MetaTrader市场购买MetaTrader 5的&#

- ¥3988.00
-
- 在MetaTrader市场购买MetaTrader 5的&#

- ¥3988.00
全网为您推荐
-
- AlgoTradeSoft

- ¥3988.00
-
- 国际期货套利软件

- ¥3988.00
-
- MT4 MT5跟单EA 本地跟单远程跟单 绝不
- ¥1100.00
-
- 在MetaTrader市场购买MetaTrader 5的&#
- ¥3988.00
-
- 在MetaTrader市场购买MetaTrader 5的&#
- ¥3988.00


