客服热线:
 手机版
 二维码































Trend Tracker
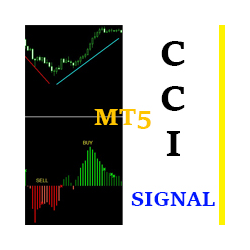
Trend Tracker uses mathematical calculation based on Bollinger, Heiken Ashi and ATR to identify trend. A strong tool and good success ratio for early identification of long trends. Its mathematical calculations identify trends on basis of break outs and market momentum.
Practice will make you perfect and Trend Tracker strong mathematical calculations will ensure high success ratio.
Features
Its early trend detection relies on complex algorithms of break outs that allows traders to get success on their manual trading skills.
- It comprises two trend lines: Trend Tracker and Swing. Traders can adopt multiple strategies due to combination of these Trend Lines for Entry Point and Exit Point.
- Flexible Tool, It can be used for any Time frame. Good success ratios for higher Time frames from M15 onwards.
- Combination of Trend Tracker and Swing on same direction, provides the ability to skip whipsaws, choppy market and market noise most of the time.
- It includes statistics, traders can adopt strategy as per statistics to set Take Profit and Stop Loss.
- It does not repaint
- It does not back paint
- It does not recalculate
Indicator Parameters
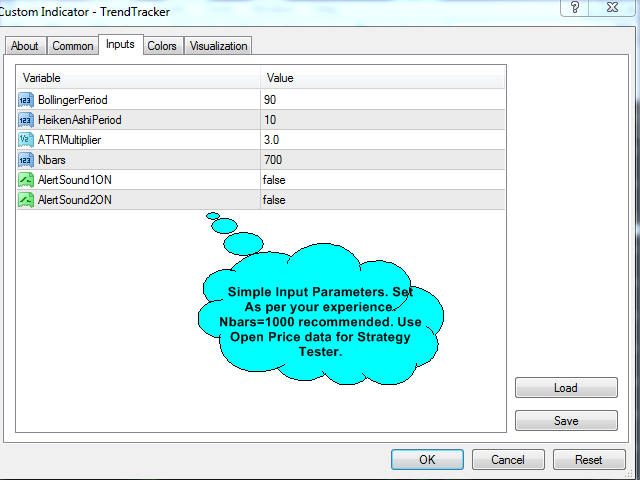
- Bollinger Band Periods - Length for Bollinger Band. It Identifies the Main Trend and colors Red for Sell and Green for Buy on Moving Average as a SwingDn and SwingUp. (Moving Average has no mathematical impact on indicator)
- Heiken Ashi Period - Heiken Ashi Period and ATR both identifying trends in parallel with Bolinger and plotting as a Trackerup for Buy and TrackerDn for Sell.
- ATR Multiplier - Heiken Ashi Period and ATR both identifying trends in parallel with Bolinger and plotting as a Trackerup for Buy and TrackerDn for Sell. ATR helps to find best BreakOuts.
- Nbars - Number of Bars to Process for indicator. Default value 1000 best optimized.
- Display Stats - True to display stat and False to hide stats
- StatClr - Select Font colors for stat
- Start TrackingFromBar: Value 0 to select tracking system to count trend pips from Candle1-Open Value. Value 1 to select tracking system to count trend pips from Candle2 Open Value.
- Emailalert1 - True/False
- Emailalert2 - True/False
- Pushalert1 - True/False
- Pushalert2 - True/False
- Sound alert1 - True/False
- Sound alert2 - True/False
Strategies
1) Main Strategy (Watch Video: https://youtu.be/kuJSbmcFCqY)
- Entry Point
- Enter Buy when Swing color changes to Green
- Enter Sell when Swing Color changes to Red
- Exit Strategy
- Exit Buy when TrackerUp turned to TrackerDn “Red”
- Exit Sell when TrackerDn turned to TrackerUp “Green”
- Exit Buy SwingUp turned to SwingDn “Red”
- Exit Sell SwingDn turned to SwingUp “Green”
- Support/Resistance Areas
- Statistical data
- Exit trades when profit reaches Average Profit Pips
- Or Exit trades when profit reaches Minimum Profit Pips
2) Secondary Strategy:
- Entry Point
- Enter Buy when TrackerDn Changes to TrackerUp “Green”
- Enter Sell when TrackerUp Changes to TrackerDn “Red”
- Use Swing Direction or Color to avoid/filter unwanted signal
- Exit Strategy
- Exit Buy when TrackerUp turned to TrackerDn “Red”
- Exit Sell when TrackerDn turned to TrackerUp “Green”
- Exit Buy SwingUp turned to SwingDn “Red”
- Exit Sell SwingDn turned to SwingUp “Green”
- Support/Resistance Areas
- Statistical Data
- Exit trades when profit reaches Average Profit Pips
- Or Exit trades when profit reaches Minimum Profit Pips
Capabilities:
- Early Trend Detection (Watch Video https://youtu.be/2-wileCa33Y)
- Clear Long Trends
- Strategy to Avoid Choppy Market
- Right Time Exit Strategy
History Bars:
Keep History Bars between 700 to 1000 for proper display of Statistics. Please note that its efficiency will be high if we are keeping minimum NBars. If we are reducing NBars more, its painting and statistics are impacted. Optimized Value is NBars=1000.
For Strategy Tester please use Open Price Data as this Indicator decides after closing of candles. Tick data is heavy for strategy tester to test it.


本店最新上架
-
- MT4 MT5跟单EA 本地跟单远程跟单 绝不

- ¥1100.00
-
- 在MetaTrader市场购买MetaTrader 5的&#
- ¥3988.00
-
- 在MetaTrader市场购买MetaTrader 5的&#
- ¥3988.00
-
- 在MetaTrader市场购买MetaTrader 5的&#

- ¥3988.00
-
- 在MetaTrader市场购买MetaTrader 5的&#

- ¥3988.00
全网为您推荐
-
- AlgoTradeSoft

- ¥3988.00
-
- 国际期货套利软件
- ¥3988.00
-
- MT4 MT5跟单EA 本地跟单远程跟单 绝不
- ¥1100.00
-
- 在MetaTrader市场购买MetaTrader 5的&#
- ¥3988.00
-
- 在MetaTrader市场购买MetaTrader 5的&#
- ¥3988.00