Sideways Market Statistical Analyzer MT4
Introduction to Sideways Market Statistical Analyzer
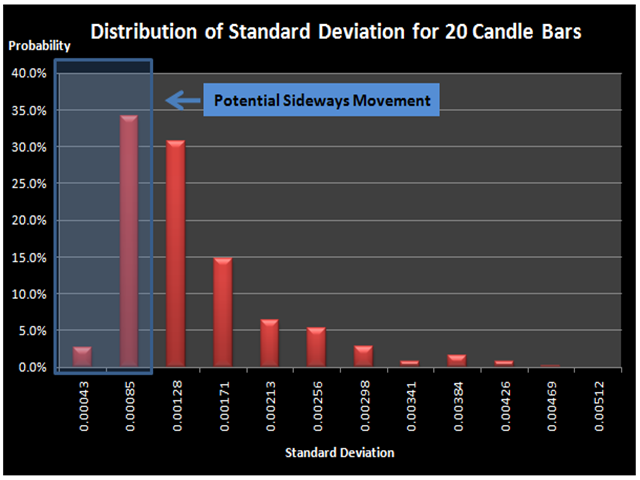
Notable period of Low volatility and non-trending movements in the financial market is considered as Sideways Market. Sooner or later, the low volatility will increase and the price will pick up a trend after Sideways Market. In terms of trading point of view, Sideways Market can serve as the very good entry timing for traders. Sideways Market is also quite often the representation of accumulation of large orders from big investors. Therefore, knowing the presence of Sideways Market can help you to decide good entry and exit timing.
Traditionally, the Average Directional Index (ADX) indicator or moving average of standard deviation indicators was used to roughly determine the presence of Sideways Market. However, both of the indicators are lagging with very low correlation with future price movement. They will not provide you clear idea on when the Sideways Market started and when it ends. Missing all these important information leaves traders with a very uncertain picture on the current market situation.
Here we have very accurate Sideways Market Analyzer inspired by the statistical theory. Indeed, this Sideways Market Statistical Analyzer can detect Sideways Market just like human eyes can do. In addition, this Sideways Market Statistical Analyzer will immediately provide the expected trading outcome when you trade with the detected Sideways Market. Therefore, you will know how much profits/loss you should expect when you trade with the detected Sideways Market. based on 9 month backtesting results, you can expect 300 pips to 1 000 pips each month when you trade with this Sideways Market Statistical Analyzer.
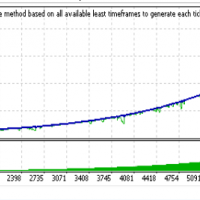
In terms of trading signal, you open a buy order when the price hits the top of the Sideways and you open a sell order when the price hits the bottom of the detected Sideways Box. Sideway Market Analyzer provides you with a fixed stop loss and take profit levels. Sideways Market Statistical Analyzer works well for most of the currency pairs. Here are some backtesting results for 9 month period on five currency pairs. Trading five currency pairs, you could expect 300 pips to 1 000 pips each month. These trading results are purely based on the assumption that you open buy and sell orders when the Sideways Market is detected without looking at any other indicators. Of course, by making additional judgement using other technical indicators, you can remove bad trades and increase your profits even further.
| Symbol | Cut Probability | Box Buffer Pips | Take Profit | Lot Multiplier | Total Net Pip gains (9 month) | Monthly Pip Gains |
|---|---|---|---|---|---|---|
| AUDCAD | 0.26 | 2 | 3.2 | 1.6 | 1 519.00 | 159.89 |
| GBPUSD | 0.16 | 0 | 2.4 | 1.6 | 1 607.60 | 169.22 |
| ERUUSD | 0.34 | 0 | 1.4 | 1.6 | 1 684.00 | 177.26 |
| EURJPY | 0.43 | 0 | 2.6 | 1.6 | 1 550.30 | 163.19 |
| EURAUD | 0.30 | 7 | 2.4 | 1.6 | 3 316.20 | 349.07 |
| Sum | 9 677.10 | 1 018.64 |
For XAUUSD (Gold), Cut Probability = 0.15, Box Buffer Pips =0, Take Profit = 1.3, Lot Multiplier = 1.6 return the total Net Pip gains of 27 265 pips during 9 month period and Monthly pip gains is 2 870 pips. So, it works very well for Gold, too.
important Trading Parameters
- Cut Probability – you can enter from 0.01 to 0.99. The value will mostly stay between 0.05 and 0.5. This cut probability is the criteria to qualify the Sideways Movement of the current group of candle bars based on the probability distribution.
- Box Buffer Pips – you can enter from 0 to 100. The value will mostly stay between 0 and 10. The pip value is the offset distance from the detected Sideways Market. This will be represented by the long horizontal line above and below the detected Sideways Market on your chart. This line can be used as the trigger point for your buy and sell orders.
- Take Profit Ratio – the Ratio of your take profit pips/box height. The value will mostly stay between 1 and 3. 1 indicates that your take profit's pips are equal to the height of the box.
- Lot Multiplier – Lot Multiplier is used when your previous trading hits stop loss. The value will mostly stay between 1.5 and 2.0. It is recommended to use the value less than 1.7.
Perfectly compatible with Harmonic Pattern Plus and Price Breakout Pattern Scanner
Just like Harmonic Pattern Plus and Price Breakout Patterns Scanner can be combined together for superb results, Sideways Market Statistical Analyzer can be combined with any of these two tools. All three tools can even be combined together. I found that Sideways Market is often detected at the same time as big harmonic patterns and breakout patterns. When they form together, the prediction power of such a pattern is highly accurate. In this web page, I show you how these patterns work together to form your own ultimate trading strategy.
本店最新上架
-
- MT4 MT5跟单EA 本地跟单远程跟单 绝不

- ¥1100.00
-
- 在MetaTrader市场购买MetaTrader 5的&#
- ¥3988.00
-
- 在MetaTrader市场购买MetaTrader 5的&#
- ¥3988.00
-
- 在MetaTrader市场购买MetaTrader 5的&#
- ¥3988.00
-
- 在MetaTrader市场购买MetaTrader 5的&#

- ¥3988.00
全网为您推荐
-
- AlgoTradeSoft

- ¥3988.00
-
- 国际期货套利软件

- ¥3988.00
-
- MT4 MT5跟单EA 本地跟单远程跟单 绝不

- ¥1100.00
-
- 在MetaTrader市场购买MetaTrader 5的&#

- ¥3988.00
-
- 在MetaTrader市场购买MetaTrader 5的&#

- ¥3988.00
 客服热线:
客服热线:


