 客服热线:
客服热线:


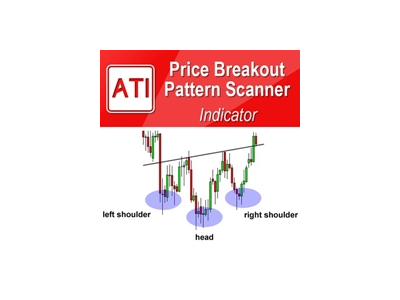
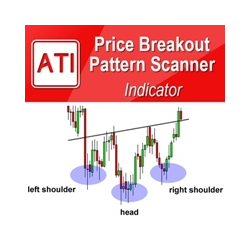


Price Breakout Pattern Scanner MT4
Price Breakout pattern Scanner is fully automatic and powerful geometric analysis for traders and investors. It can detect following patterns automatically from your chart.
- Head and Shoulder - Common tradable pattern.
- Reverse Head and Shoulder - This pattern is the reverse formation of the Head and Shoulder.
- Double Top - When the price hits resistance level twice and decline toward the support level, the trader can anticipate sudden bearish breakout through the support level.
- Double Bottom - The double bottom pattern is the reverse shape of the Double Top.
- Triple Top - When the price hits resistance level three times and decline toward the support level, the trader can anticipate sudden bearish breakout through the support level.
- Triple Bottom - The triple top pattern is the reverse pattern of the triple top.
- Triangle - Several different types of triangle pattern include symmetric Triangle, Ascending Triangle and Descending Triangle.
- Rising wedge - This pattern is similar to triangle. However, their angle is stiffer than standard triangle.
- Falling wedge -This pattern has similar look to triangle too. However, their angle is stiffer than standard triangle.
- 52 Candlestick patterns – the Price Breakout Pattern Scanner can detect 52 different bearish and bullish candlestick patterns include hanging man, shooting star, engulfing, doji, Harami, etc.
Beside this pattern detection, you can use full feature of Smart Renko indicator, automatic round number detection and guided trading instruction feature.
Main Parameter Description
You can use Price Breakout Pattern Scanner for many different mode. If support and resistance are important for your trading, then you can run the Price Breakout Pattern scanner in Support Resistance mode. For that, set “Display As Support Resistance” = true. If you set “Display As Support Resistance” = false, then Price Breakout pattern scanner will show patterns drawn in triangles. With Price Breakout pattern scanner, it is possible to apply them in custom timeframe. This means that you can apply several price breakout pattern scanner in one chart. To apply price breakout pattern scanner in custom timeframe, set “Timeframe to detect Price Breakout Patterns” to your preferred one including H1, H4, D1, W1 or MN1, etc.
- Set false to switch off Price Breakout Pattern Scanning:
- Use Renko Filter for Pattern detection : true or false only
- Timeframe to detect Price Breakout Patterns
- Display As Support Resistance (true = support resistance, false = triangle)
- Max number of patterns to display: Control this input if you want to see more than one pattern simultaneously. For example, set this to 3, then price breakout pattern scanner will show 3 latest patterns at the same time.
- Pattern Index from which to display: 0 = default
- Enable sound alert: set to true to get sound alert
- Send email if pattern is found: set to true to receive email alert
- Send notification if pattern is found: set to true to receive push notification. Push notification is recommended over email notification.
How to apply Price Breakout pattern Scanner on multiple timeframe
You can apply Price Breakout Pattern Scanner on multiple timeframe in single chart. This will allow you to perform total geometric analysis in fully automatic manner. You can get short, medium, long terms analysis in one single chart. To apply multiple Price Breakout Pattern Scanner in one chart, you need to change the “Timeframe to detect Pattern” and “Button Coordinate Y”. If you do not change “Button Coordinate Y”, then you will not be able to control all price Breakout Pattern Scanner since some buttons will be hidden under the other buttons. For a general guidance, set Button Coordinate Y to 80 for second Price Breakout Pattern Scanner. Likewise, you can set button coordinate Y to 100 for third Price Breakout Pattern Scanner assuming that your button height is 20.
Further Note about Price Breakout Pattern Scanner
Price Breakout Pattern scanner is very sophisticated trading system. We cannot put all the description in this short page. For more details, please find out from our comment section here.


 nload="if(window.viewGallery_GalleryManager) viewGallery_GalleryManager.ImageonLoad(this,7);" />
 nload="if(window.viewGallery_GalleryManager) viewGallery_GalleryManager.ImageonLoad(this,8);" />
 nload="if(window.viewGallery_GalleryManager) viewGallery_GalleryManager.ImageonLoad(this,9);" />
 nload="if(window.viewGallery_GalleryManager) viewGallery_GalleryManager.ImageonLoad(this,10);" />
 nload="if(window.viewGallery_GalleryManager) viewGallery_GalleryManager.ImageonLoad(this,11);" />
本店最新上架
-
- MT4 MT5跟单EA 本地跟单远程跟单 绝不

- ¥1100.00
-
- 在MetaTrader市场购买MetaTrader 5的&#

- ¥3988.00
-
- 在MetaTrader市场购买MetaTrader 5的&#

- ¥3988.00
-
- 在MetaTrader市场购买MetaTrader 5的&#

- ¥3988.00
-
- 在MetaTrader市场购买MetaTrader 5的&#

- ¥3988.00
全网为您推荐
-
- AlgoTradeSoft

- ¥3988.00
-
- 国际期货套利软件

- ¥3988.00
-
- MT4 MT5跟单EA 本地跟单远程跟单 绝不
- ¥1100.00
-
- 在MetaTrader市场购买MetaTrader 5的&#
- ¥3988.00
-
- 在MetaTrader市场购买MetaTrader 5的&#
- ¥3988.00


