 客服热线:
客服热线:


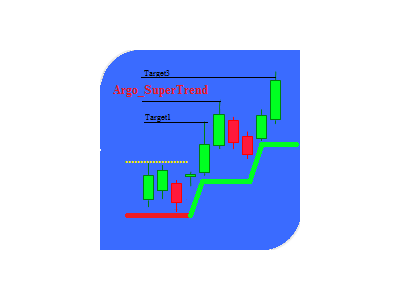


ArgoSuperTrend
The indicator is a ready-made trading system. It identifies all main market states (trend, pullback, flat) allowing you to enter the market at any time and use any methods and trading styles.
There is no need to describe the indicator's operation principle, since the settings are self-explanatory. CCI is calculated based on smoothed price series.
It has two main rows of dots, as well as an additional one and target levels in the form of lines. The candles can be colored depending on fastCCI location, though it is not mandatory (and can be disabled). This feature is of informative nature and depends on trader's preferences. The same refers to the timer displaying the time left before the candle is closed.
The first row of yellow dots shows the direction of the global trend. If the dots are located below the price, the trend is bullish, otherwise, it is bearish. It is also used to place a "rigid" stop when entering the market by trend and applying a conservative trading style. When trading against a trend, their location is defined by the target level. The row is generated as a percentage value of reached critical points (you can select Close or High-Low). The row can be configured in the settings and requires fitting according to the market type (FOREX, stock, commodity, volatility) or trader's preferences (risks, style, etc.).
To do this, simply apply the indicator to a symbol chart and evaluate visually the location of yellow dots relative to price and your preferences by going through Fibonacci numbers (preferred method). It should be mentioned that location of the main levels (global trend, target levels) DOES NOT DEPEND ON the chart period for intraday trading ("drawSlow-HIGH_LOW"). In other words, their readings (both on М1 and Н4) remain unchanged. The same refers to the charts larger than D1. In case of "drawSlow-CLOSE", the differences are insignificant, since the lowest (highest) price of closing candles on Н1 and М15 may vary. However, they are not so important.
The second row of dots has three colors: red, dark blue and light blue. The red one indicates bearish trend market, the dark blue one - bullish trend, while the light blue one stands for the flat market. The signal is generated of two criteria: market direction (falling-rising price series) and location of the slow CCI (below, above or between certain levels). Period and level are customizable. If there are mismatches between price direction and CCI readings, the former has a priority. In other words, if ССI is located between FletLevel levels (uncertainty zone on the market), while the price is still rising, the dots are dark blue. The color is changed to light blue only if the next maximum is not reached.
The same is true for the downward trend. Position of dots on the chart defines the bar's maximum (minimum) and ATR(5) indicator value. Their price value can be used for trailing stop (moving stop to the price value of the previous candle's dot). Calculation and generation method makes it one of the varieties of the "Moving Average with Dynamic Smoothing Period" with an additional CCI filter. Therefore, the rules applicable to this indicator should be considered while trading.
The target levels are based on Fibonacci numbers. Their set can be changed in the settings by separating them using ";" with no spaces and, preferably, in ascending order to avoid confusion in the description (in order to ensure that 138.2 will be #5, while 261.8 - #1). For the same reason, correction levels should be specified at the very end of the list. The level lines continue on the screen till they are no longer relevant or the global trend has changed.
The additional row of puple dots appears when the main one (yellow dots) is moving with no changes in its price level within a certain amount of bars, and is based on price maximum (minimum) reached during the period. Thereby, the price channel is formed, within which correction or flat movement occurs. The indicator is convenient when trading against trend or scalping.
If the candles are red, fast CCI is below "-CCiLevel". Green color indicates than fast CCI is located above "CCiLevel", while yellow one shows that fast CCI is between them. Fast CCI period, CCiLevel and number of bars are customizable.
Settings
- fiboK - distance to the main line (yellow dots) in Fibonacci numbers.
- drawSlow - prices used for building trend lines (yellow dots).
- targetFiboLevel - set of Fibo levels for defining target levels.
- LevelStyle - style of target level lines.
- LevelWidth - width of target level lines.
- slowCCiPeriod - slow CCI period for determining the market trend (it defines the color of the second main set of dots).
- fastCCiPeriod - fast ССI period (affects the color of candles).
- FletLevel - if slow CCI ("+","-") is located between the levels specified here, the market is considered to be in state of uncertainty.
- CCiLevel - if fast CCI ("+","-") is located between the levels specified here, the market is considered to be in state of uncertainty.
- candleCCI - enable bar coloring function according to fast CCI location. In case of "BARS" or "CANDLES", a price chart is automatically moved to the background.
- candleBack - colored candles in the background.
- CCIPrice - select price for calculating the price series (used for calculating CCI).
- barFlet - when the specified amount of bars is reached, correction or flat is considered to have started (yellow dots are moved sideways).
- totalFastCCIbar - number of bars to be colored.
- AutoScale - autoscale of dots and candles.
- sizeArrow - size of dots (AutoScale==false).
- font_size - target levels' text size.
- text_color - target levels' text color.
- alertON - global trend change signal.
- EmailON - sending a message via email.
- clockVisibility - visibility of the countdown timer before a candle is closed.
- secondsToBarClose - enable an audio signal activated when a specified number of seconds before a candle closure is reached.
- timeColor - timer color.
- font_sizeClock - timer font size.
- clockalertON - disable timer signal.
- soundAlarm - name of a *.wav format file to be played in case "clockalertON=true".


本店最新上架
-
- MT4 MT5跟单EA 本地跟单远程跟单 绝不

- ¥1100.00
-
- 在MetaTrader市场购买MetaTrader 5的&#

- ¥3988.00
-
- 在MetaTrader市场购买MetaTrader 5的&#

- ¥3988.00
-
- 在MetaTrader市场购买MetaTrader 5的&#

- ¥3988.00
-
- 在MetaTrader市场购买MetaTrader 5的&#

- ¥3988.00
全网为您推荐
-
- AlgoTradeSoft

- ¥3988.00
-
- 国际期货套利软件

- ¥3988.00
-
- MT4 MT5跟单EA 本地跟单远程跟单 绝不
- ¥1100.00
-
- 在MetaTrader市场购买MetaTrader 5的&#
- ¥3988.00
-
- 在MetaTrader市场购买MetaTrader 5的&#
- ¥3988.00


