 客服热线:
 手机版
 二维码




































Chart Projection
Chart Projection started as a simple small indicator that used zigzag to project 2 levels the price was probably going to reach.
With the update a new algorithm has been introduced which does not rely on the ZigZag, thus avoiding repaints and providing solid calculation data in order to get to the price forecast.
Operation
*Whenever "POI" is mentioned, it refers to a Chart High or Chart Low price level. Imagine a POI (Point of Interest) being the price at which 2 ZigZag Lines connect.
*Whenever "Optic(s)" is mentioned, it refers to the new equivalent of the ZigZag algorithm.
Chart Projection is now equipped with 3 Optics Algorithms, for Low, Mid and High range scanning of a pairs price action. Each Optic gathers historical data immediately relevant to a charts Highs and Lows (POI's), such as:
- Price Action before the POI
- Price Action after the POI
- Time leading up to the POI
- Time for consolidation after the POI
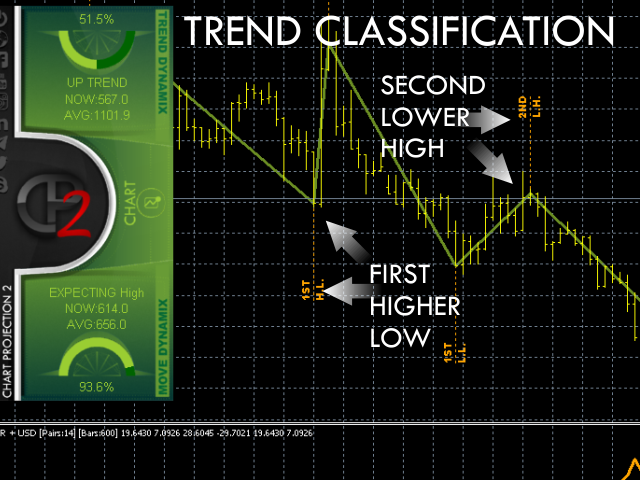
- Trend classification before the POI
- A POI's role within the overall trend
Data from each Optic is gathered continuously as price develops and produces optimized estimates for how price behaves when specific POI's emerge. When a POI is detected, a matching process takes place which tries to find the most similar set of optimized data that fits price behavior around that POI. For example, a Second Higher High is detected on the chart. It will be matched with all recent behavioral data for Second Higher Highs, and a forecast with 2 price moves will be produced.
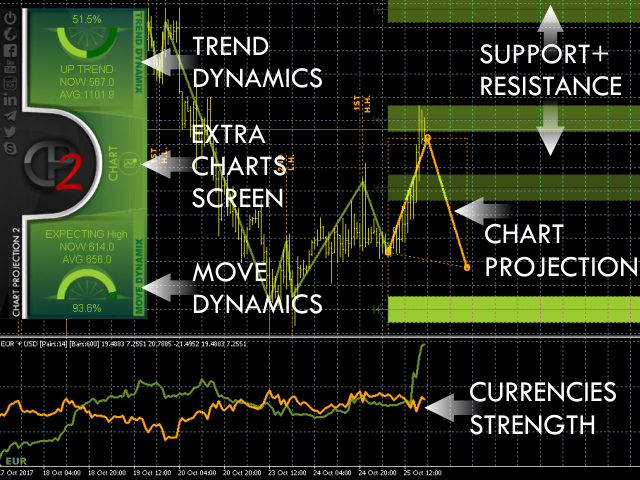
The latest update brings additional features to it such as:
- Seven additional projection methods including the original one.
- Display of support and resistance zones.
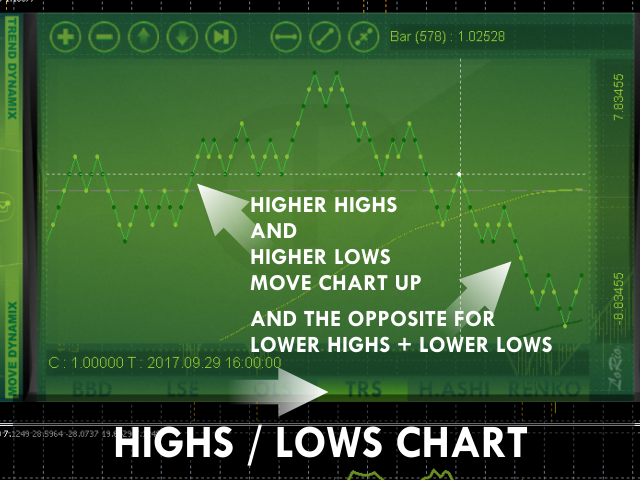
- Display of Highs/Lows and their place within the overall trend.
- Lightweight Currency Strength index, with separate display window.
- Trend monitoring and current asset move identification.
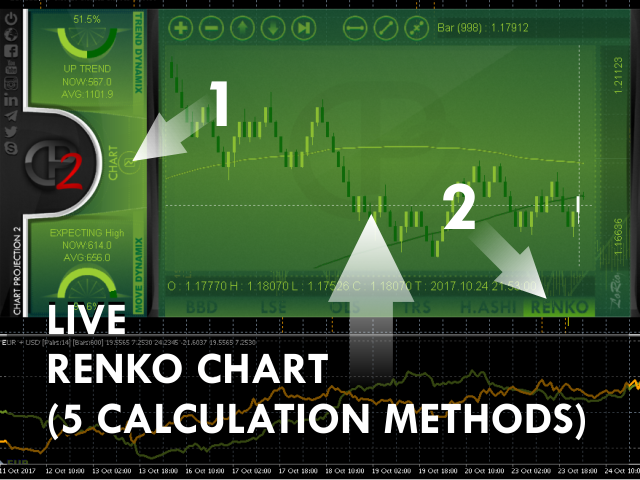
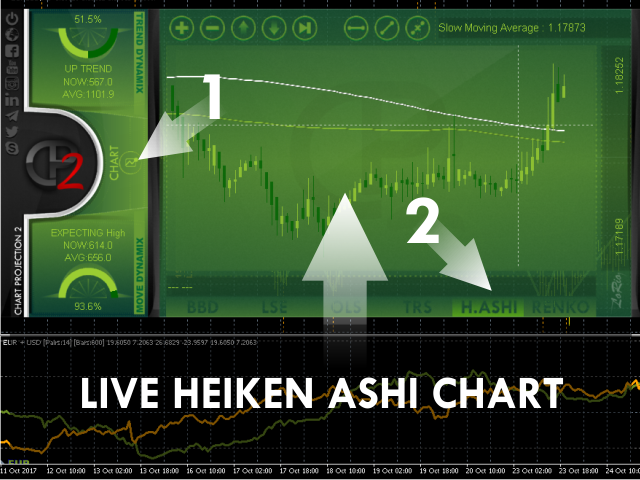
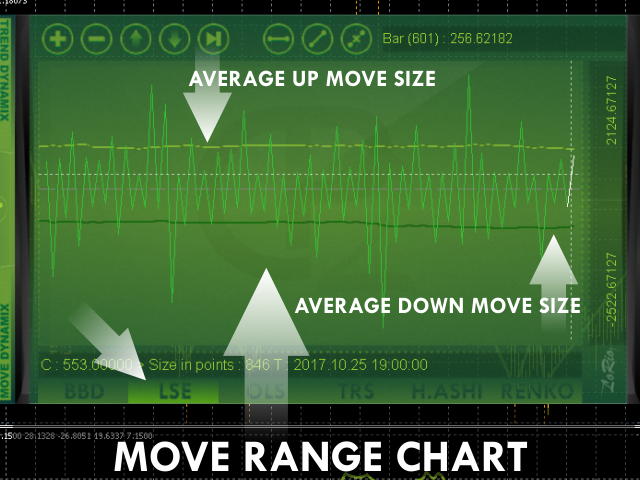
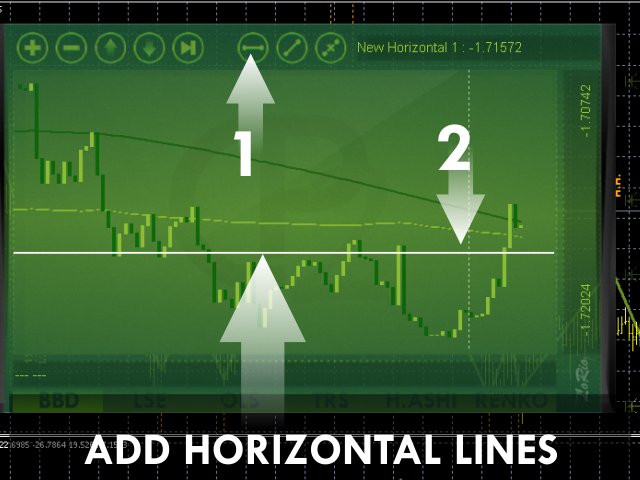
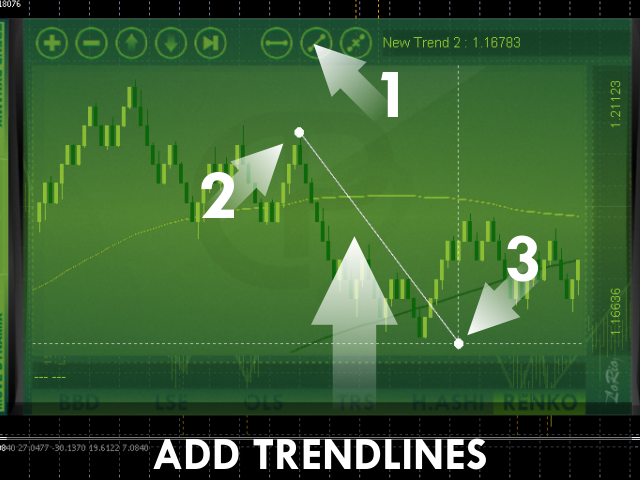
- Extra charting abilities with 6 chart types
- Repainting issues were fixed
Projection Settings
- Price Used For Calculations - Choose which price will be used to determine Highs and Lows
- Capture Scale - The greater the value the wider the distance between Highs and Lows captured is going to be. Minimum value should be 1, the maximum around 6.
- Move Legs Drawn Bars Limit - CP Draws Move legs. For not stressing the terminal enter the bar after which drawing is enabled.
- Projection Method - Select which method is going to be used for the Chart Projection.
- Simple - Averaging up moves and down moves.
- Simple Specific - Averaging up and down moves that have the same place in the trend.
- Flexible Specific - Averaging based on ratio to the encompassing trend.
- Longscope Simple - Longer projection based on average long-term market response to Highs/Lows.
- Longscope Flexible - Longer projection based on average long-term market response to Highs/Lows relevant to the encompassing trend.
- Complex - All of the above combined.
- S+R - Via calculation of Support/Resistance levels that will likely hold.
- Original(C.P.1) - Exact calculation as the first version, with no repaints.
- Moves to Use - Move legs required for calculating averages.
- ZigZag Depth - ZigZag depth for C.P.1 Calculation only.
- ZigZag Deviation - ZigZag Deviation for C.P.1 Calculation only.
- ZigZag Backstep - ZigZag Backstep for C.P.1 Calculation only.
- Animated projection ? - Enable animation of the Chart Projection.
Currency Strength Settings:
- Currency Strength Period - Averaging Period for Currency Strength Indexes.
- Currency Averaging Method - Averaging Method for Currency Strength Indexes.
- Currency Strength Pairs Limit - Maximum number of pairs allowed for the Strength calculation (per currency).
- Currency Strength All Pairs Bars (dont set below period) - Minimum Bars Required in all strength calculation pairs.
- CS Plot Method - Select the output method of the Currency Strength Index.
- Currencies - Both currencies.
- Difference - Just their difference.
- CS Calc Type - Select Currency Strength Index calculation approach.
- Simple - Range of Pairs is calculated once on initialization.
- Deep - Range of Pairs is calculated every time before the strength is summed up.
Overlay Chart Settings:
- Show Overlay Chart? - Enable or Disable overlay chart.
- Default Open Chart - Select which extra chart should be visible first when the overlay chart is active.
- Renko Chart Initial Calculation - For the extra Renko chart, select the initial calculation method.
- CurrentTF HiLo - Use current timeframe High and Low prices only.
- CurrentTF Close - Use current timeframe Close prices only.
- M1 HiLo - Use M1 timeframe High and Low prices only.
- M1 Close - Use M1 timeframe Close prices only.
- Renko Chart Live Calculation - For the extra Renko chart, select live feed for the chart.
- CurrentTF HiLo - Use High/Low of the current timeframe. Updates when a new bar forms on the current TF.
- CurrentTF Close - Use Close of the current timeframe. Updates when a new bar forms on the current TF.
- M1 HiLo - Use High/Low of the M1 timeframe. Updates when a new bar forms on the M1 TF.
- M1 Close - Use Close of the M1 timeframe. Updates when a new bar forms on the M1 TF.
- Live Price - Use current Bid price. Updates on every Tick.
- Renko Brick Size Method - Choose the Brick size calculation method for Renko.
- UserSet - Will use the value provided in "User Set Brick Size in Points".
- Auto - Will use the range resulting from the Capture Scale (start of inputs) multiplied by "Auto Brick Size Multiplier".
- Grounded Renko - Setting this to "Yes" will allow the internal Renko mechanism to deter repainting Renko bars.
Other Settings:
- Show Support + Resistance ? - Enable/Disable display of Support and Resistance Levels on the chart.
- Projection Width - Set the line width for the main projection on chart display.
- Projection Glow Width - Set the line width for the shade (glow) of the chart projection.
- Move Legs Width - Set the line width for the asset movement display (the ZigZag equivalent lines).
- Trend Steps Font Size - Set the font size for the "Highs" and "Lows" chart displays.
- Font Size Multiple - Set a universal font size multiplier in case text appears too big or too small.

 nload="if(window.viewGallery_GalleryManager) viewGallery_GalleryManager.ImageonLoad(this,7);" />
 nload="if(window.viewGallery_GalleryManager) viewGallery_GalleryManager.ImageonLoad(this,8);" />
本店最新上架
-
- MT4 MT5跟单EA 本地跟单远程跟单 绝不

- ¥1100.00
-
- 在MetaTrader市场购买MetaTrader 5的&#

- ¥3988.00
-
- 在MetaTrader市场购买MetaTrader 5的&#

- ¥3988.00
-
- 在MetaTrader市场购买MetaTrader 5的&#

- ¥3988.00
-
- 在MetaTrader市场购买MetaTrader 5的&#

- ¥3988.00
全网为您推荐
-
- AlgoTradeSoft

- ¥3988.00
-
- 国际期货套利软件

- ¥3988.00
-
- MT4 MT5跟单EA 本地跟单远程跟单 绝不
- ¥1100.00
-
- 在MetaTrader市场购买MetaTrader 5的&#
- ¥3988.00
-
- 在MetaTrader市场购买MetaTrader 5的&#
- ¥3988.00


