客服热线:
 手机版
 二维码


























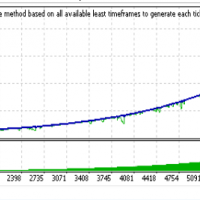



Support and resistance at zigzag
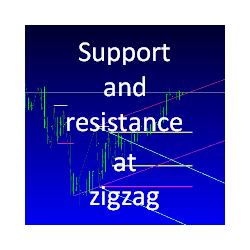
This indicator displays support and resistance levels according to highs and lows of the HZZ indicator described in "How to Write Fast Non-Redrawing ZigZags" by CANDID. The indicator's performance is based on the assumption that completion of the previous trend and beginning of a new one are the best points to enter the market. The indicator forms support lines indicated by a color of the support variable and resistance lines indicated by a color of the resistance variable.
The last swing in the calculation area is also indicated by a color of the last_swing variable. A candle close above the resistance level and after receiving a confirming signal from other market indicators (for example CCI and MACD oscillators) can be considered as a Buy signal. Similarly a candle close below the resistance level can be considered as a Sell signal.
You can enter again in the market movement direction when the last swing level is crossed. Price breakout from the stated levels can also indicate a signal of the trend continuation in the same direction. You can set the indicator changing H variable in the main menu.


本店最新上架
-
- MT4 MT5跟单EA 本地跟单远程跟单 绝不

- ¥1100.00
-
- 在MetaTrader市场购买MetaTrader 5的&#
- ¥3988.00
-
- 在MetaTrader市场购买MetaTrader 5的&#
- ¥3988.00
-
- 在MetaTrader市场购买MetaTrader 5的&#
- ¥3988.00
-
- 在MetaTrader市场购买MetaTrader 5的&#

- ¥3988.00
全网为您推荐
-
- AlgoTradeSoft

- ¥3988.00
-
- 国际期货套利软件

- ¥3988.00
-
- MT4 MT5跟单EA 本地跟单远程跟单 绝不
- ¥1100.00
-
- 在MetaTrader市场购买MetaTrader 5的&#
- ¥3988.00
-
- 在MetaTrader市场购买MetaTrader 5的&#
- ¥3988.00