客服热线:
 手机版
 二维码


























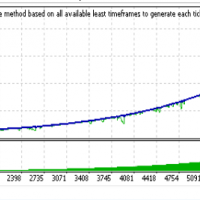



VSAMultiAnalizeDEMO
The VSAMultiAnalizeDEMO indicator is a free demo version of the VSAMultiAnalize
and VSAMultiAnalizeMT5
indicators.
The VSAMultiAnalize indicator serves to construct a horizontal volume profile and delta on the symbol graph (VSA - Volume spread analysis). Construction can be performed in various ways.
Input parameters:
- View Type. What is displayed on the chart.
- Volume by Range. The horizontal volume profile for the specified timeframe is the Target parameter.
- Previous and current. Two horizontal volume profiles for the current and past period (for example for the current and last day).
- Buy & Sell. Separate profiles of horizontal volumes for buying and selling.
- Delta. Diagram of the Delta.
- Style. The style of the diagram.
- Line. Horizontal lines (default).
- Rectangle. Rectangles.
- Count. The initial number of diagrams on the graph (default 5, max 10).
- Target. Diagrams are built for this timeframe (the default is D1).
- Source. Data source for plotting charts (by default this is M1).
- Volume Type. Tick or real volume values are used (default is tick).
- Diag's step. Attention! only for experts. Averaging parameter of the diagram data.
- Horizontal Size. Attention! only for experts. The maximum size of the diagrams horizontally.
- Value Area (VA) percent. Value area in percent.
- Main Color, Color for Buy, Color for Sell, Value Area (VA). Main colors of diagrams.
- Width. The thickness of the diagram lines (default 1).
- Additional Levels Width. The thickness of lines of additional levels (the default is 2).
- Max. Volume. The color of the maximum volume level.
- Median Vol. The color of the level of the median volume (half of the total).
- Vol. Weighted Average Price Color. Color VWAP level.
The video and screenshots show the constructions with the following parameters:
- Target = D1
- Source = M1
Buildings are performed on the timeframe H1. Horizontal profiles of daily volume are shown, current and last day volume profiles, daily volume profiles, split into two parts - for buy and sale, delta profiles. In all cases, the timeframe M1 was used for the source data.
The VSAMultiAnalizeDEMO works on two currency pairs: CADJPY and EURCHF.


 nload="if(window.viewGallery_GalleryManager) viewGallery_GalleryManager.ImageonLoad(this,7);" />
本店最新上架
-
- MT4 MT5跟单EA 本地跟单远程跟单 绝不

- ¥1100.00
-
- 在MetaTrader市场购买MetaTrader 5的&#
- ¥3988.00
-
- 在MetaTrader市场购买MetaTrader 5的&#
- ¥3988.00
-
- 在MetaTrader市场购买MetaTrader 5的&#
- ¥3988.00
-
- 在MetaTrader市场购买MetaTrader 5的&#

- ¥3988.00
全网为您推荐
-
- AlgoTradeSoft

- ¥3988.00
-
- 国际期货套利软件
- ¥3988.00
-
- MT4 MT5跟单EA 本地跟单远程跟单 绝不
- ¥1100.00
-
- 在MetaTrader市场购买MetaTrader 5的&#
- ¥3988.00
-
- 在MetaTrader市场购买MetaTrader 5的&#
- ¥3988.00