客服热线:
 手机版
 二维码




















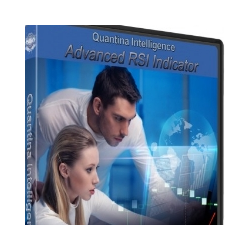









Quantina Advanced RSI Indicator
One of the most popular technical analysis indicator is the Relative Strength Index (RSI) is an oscillator that measures current price strength in relation to previous prices. The RSI is a highly recommended tool for traders, it can be used to:
- Generate BUY and SELL signals
- Show Overbought and Oversold conditions
- Warn of price reversals through divergences
How to use RSI Indicator
The (RSI) Relative Strength Index Indicator is going to measure price changes over the past XX periods (where XX being the input that you can enter into the indicator. Default is 14.)
If you set RSI of 14 periods, it will measure the strength of this unclosed candle's price movement against the previous 13 closed candles (for a total of the last 14 periods). If you use RSI Indicator on 28 periods, you will be measuring this candle's strength or weakness to the last 27 periods. The higher or more periods you use, means "slower" the indicator will appear to react to recent price changes. (Lower number of periods = more signals).
As a momentum oscillator, RSI Indicator will read a value between 1 and 100, and it will show you how strong or weak price has been over the observed number of periods. If RSI is reading above 70, traders will often construe that to mean that price action has been strong, and the asset being charted may be "Over Bought".
- RSI Buy Signal — Buy when the RSI crosses above the oversold line (30).
- RSI Sell Signal — Sell when the RSI crosses below the overbought line (70).
RSI Divergences Relative Strength Index
An alternative way that the Relative Strength Index (RSI) gives buy and sell signals is given below:
Buy when price and the Relative Strength Index are both rising and the RSI crosses above the 50 Line.
Sell when the price and the RSI are both falling and the RSI crosses below the 50 Line.
Parameters
- Period: Default settings is 14. Here you can set your measured time as per your timeframe.
- ApplyTo: Defaults settings is Close Price. Here you can set which point of price are calculated. Close Price = measured at the end of candle, closed candle.
- Oversold Below: Here you can set a lowest level of RSI Indicator between 1 - 100. Default is 30. If RSI value is going under this level you can get an alert, also you will get another alert if RSI level came back from this (30) level.
- Overbought Above: Here you can set the a highest level of RSI Indicator between 1 - 100. Default is 70. If RSI value is going above of this level you can get an alert (overbought), also you will get another alert if RSI level came back from this (70) level.
- alert Enabled (true/false): you can turn ON or OFF the trading alert function.
- PushNotificationEnabled (true/false): true = ON, in this case metaTrader 4 terminal will send you a push notification to your phone when there is an alert (OverBought or OverSold).
- EmailalertEnabled (true/false): true = ON, in this case metaTrader 4 terminal will send you an email to your previously set email address when there is an alert (OverBought or OverSold).


本店最新上架
-
- MT4 MT5跟单EA 本地跟单远程跟单 绝不

- ¥1100.00
-
- 在MetaTrader市场购买MetaTrader 5的&#
- ¥3988.00
-
- 在MetaTrader市场购买MetaTrader 5的&#
- ¥3988.00
-
- 在MetaTrader市场购买MetaTrader 5的&#
- ¥3988.00
-
- 在MetaTrader市场购买MetaTrader 5的&#

- ¥3988.00
全网为您推荐
-
- AlgoTradeSoft

- ¥3988.00
-
- 国际期货套利软件

- ¥3988.00
-
- MT4 MT5跟单EA 本地跟单远程跟单 绝不
- ¥1100.00
-
- 在MetaTrader市场购买MetaTrader 5的&#
- ¥3988.00
-
- 在MetaTrader市场购买MetaTrader 5的&#
- ¥3988.00