 客服热线:
 手机版
 二维码




































EMA Multi meter
How the Indicator Works:
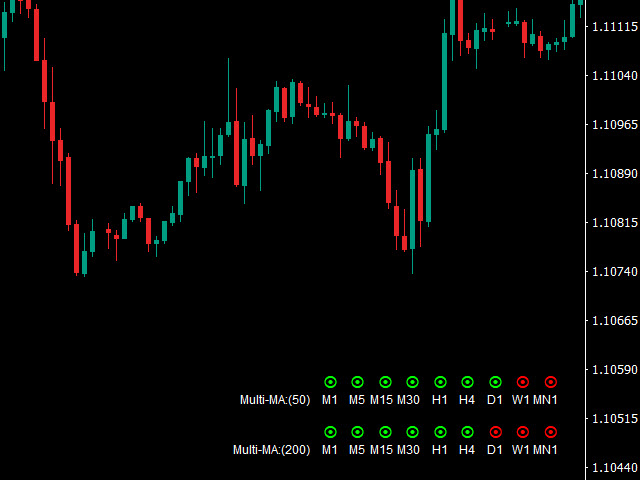
This is a Multi-timeframe MA multimeter indicator which studies if price is above or below a particular EMA range and shows Red/Green/Yellow signals.
Red: Price Below EMA range
Green: Price above range
Yellow: Price within range
Indicator Properties:
EMA Settings:
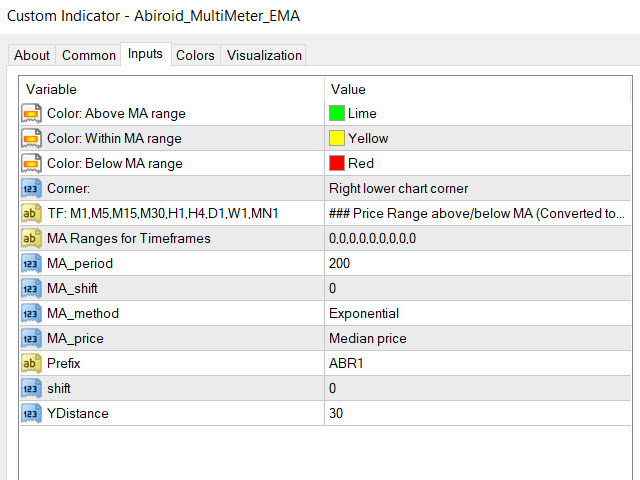
- Default Period is 200. You can change all MA Settings like Period, MA Method (SMA, EMA, etc) or MA Applied Price (Close, Open, etc).
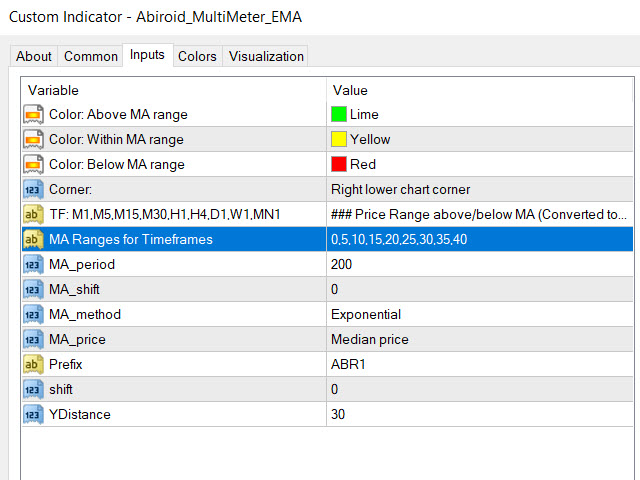
- EMA Range list is a comma separated value list for different timeframes. It will be converted to points.
If price is above range it is green, price below is red and price within is Yellow.
E.g. EURUSD: If for M1 you need to use just 5 Points it will be 0.00005.
But for a higher TF like H1 you need to use a greater range like 25, so it will be converted to 0.000025.
By default list is 0,0,0,0,0,0,0,0,0 for all 9 timeframes M1,M5,M15,M30,H1,H4,D1,W1,MN1 respectively.
But you can set it to something like: 5,10,15,20,25,30,35,40,45
If any value is missing it will be 0 by default.
- You can change colors for Up/Down/Within range.
- And also which corner of screen this multimeter will appear.
- And Y-position. This is helpful if you need several multi-meters for different EMAs. Also change Prefix for multiple multimeters so that they don't overwrite each other.
- WaitTicks: Wait for number of ticks before refreshing multi-meter. Keep higher number like 200 or 500 for better performance.
about EMAs:
EMA (Exponential Moving Average) is a very good indicator of current Trend. Especially a higher 200 period one.
In EMA, more weight is given to the most recent data and the EMA reacts faster to recent price changes.
So, studying different Timeframes EMA together can give a very good indication of the overall market trend.
That's why this Multi Timeframe Indicator is very helpful.
Trends:
Downtrend: The price is below 200 EMA.
Uptrend: The price is above 200 EMA.
Good EMA Strategy:
- Find the Trend:
1. Look at the D1 trend
2. Look at the trend on H4 if it has the same trend with the daily chart.
3. Look at H1 and see if it has the same trend with H4 and daily chart.
- Next:
On the H1, wait for the price to touch back to the 200 EMA and enter on the reversal. You can identify reversal through the reversal candlestick.
If you are thinking of a sell position, place sell stop order 3-5 pips below the low of the reversal candlestick and set stop loss 10-15 pips above the high of the reversal candlestick.
If you are thinking of a buy position, place buy stop order 3-5 pips above the high of the reversal candlestick and set stop loss 10-15 pips below the low of the reversal candlestick.
Target profit is at the previous swing high or low on the H1 timeframe, or you can trail the stops by moving the stop loss if the market move in favor of your position.
Combine this strategy with Price Action and Support/Resistance for best results.
Look at the screenshots for Multiple Multi-meters and how they look. And for settings screens.


本店最新上架
-
- MT4 MT5跟单EA 本地跟单远程跟单 绝不

- ¥1100.00
-
- 在MetaTrader市场购买MetaTrader 5的&#

- ¥3988.00
-
- 在MetaTrader市场购买MetaTrader 5的&#

- ¥3988.00
-
- 在MetaTrader市场购买MetaTrader 5的&#

- ¥3988.00
-
- 在MetaTrader市场购买MetaTrader 5的&#

- ¥3988.00
全网为您推荐
-
- AlgoTradeSoft

- ¥3988.00
-
- 国际期货套利软件

- ¥3988.00
-
- MT4 MT5跟单EA 本地跟单远程跟单 绝不
- ¥1100.00
-
- 在MetaTrader市场购买MetaTrader 5的&#
- ¥3988.00
-
- 在MetaTrader市场购买MetaTrader 5的&#
- ¥3988.00


