 客服热线:
 手机版
 二维码





































SFT Full OsMA
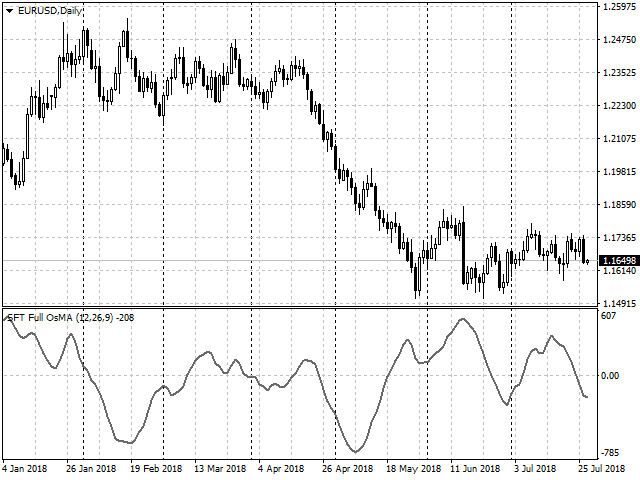
A classic indicator with advanced features for more accurate display of the market situation.
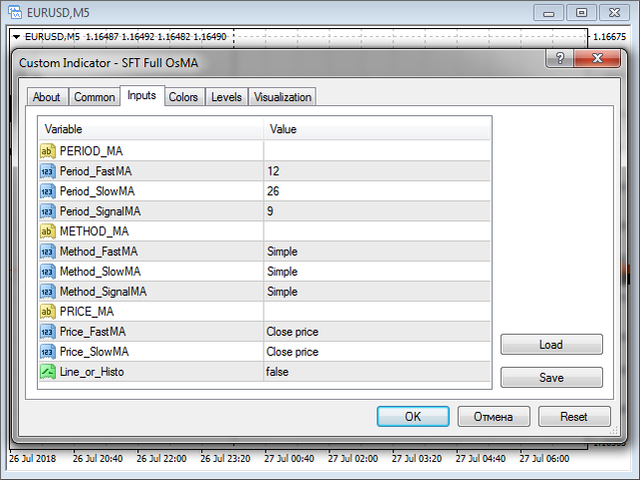
All settings of all moving averages are available, such as the moving average type and the priced used in its calculation.
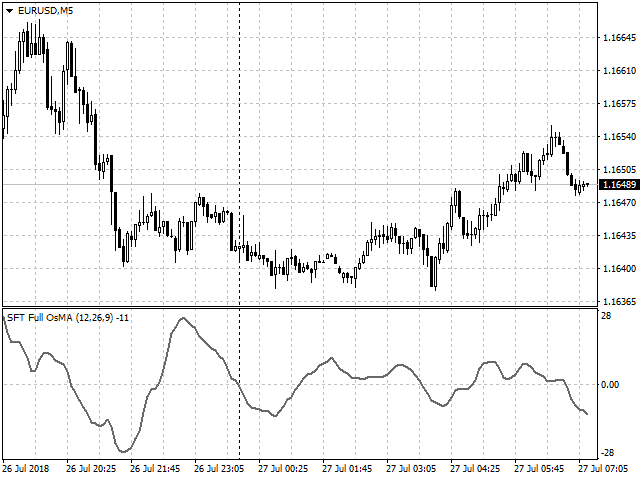
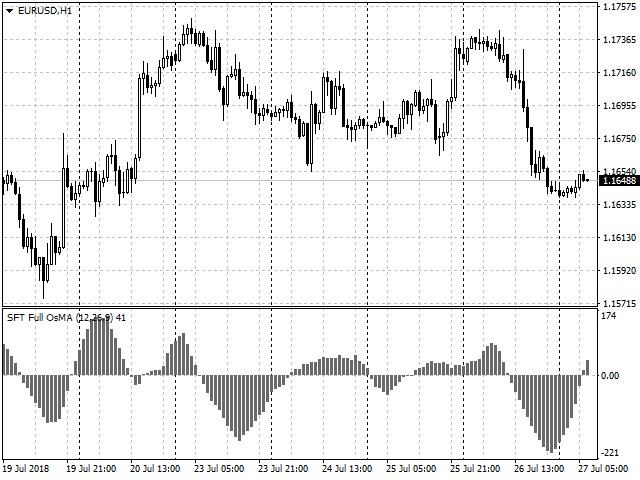
It is also possible to change the appearance of the indicator - line or histogram.
Additional parameters provide the ability of fine tuning.
Distinctive features
- Does not redraw.
- Additional parameters for fine tuning.
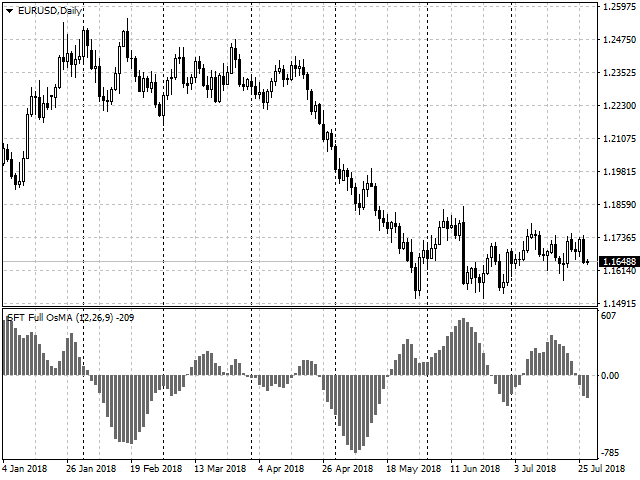
- Displayed as a line or as a histogram.
- Works on all timeframes and symbols.
- Suitable for manual trading and development of Expert Advisors.
For more accurate entries and additional confirmation of signals, it can be used in conjunction with other indicators.
Setting up the indicator
- Period_FastMA - period of the fast moving average.
- Period_SlowMA - period of the slow moving average
- Period_SignalMA - period of the signal moving average.
- Method_FastMA - type of the fast moving average.
- Method_SlowMA - type of the slow moving average.
- Method_SignalMA - type of the signal moving average.
- Price_FastMA - price for plotting the fast moving average.
- Price_SlowMA - price for plotting the slow moving average.
- Line_or_Histo - display the indicator as a line (true) or as a histogram (false).
Trading Recommendations
- If the histogram (line) is located above zero and the Highs are rising, an ascending trend is present in the market.
- If the histogram (line) is located below zero and the Lows are falling, a descending trend is present in the market.
- Appearance of locals Lows and Highs on the histogram indicates that the price may reverse or start a correction.
- A sell signal is formed when the histogram (line) crosses the zero level downwards, and upwards for a buy signal.
- The classic signals of divergence between the indicator and the price chart serve as additional confirmation signals.
- The trade direction should correspond to the direction of the trend on a higher timeframe.
- Exit the trades at a reverse signal or at the defined SL and TP levels.
- When using SL and TP, set SL beyond the nearest extremum, TP = 1..2 SL.
Other trading options are also possible, you can develop the most convenient tactics for you in the process of trading.
Additional information and a more detailed overview of trading methods can be seen here:
We wish you a stable and profitable trading.
Thank you for using our software.
If you like it, share a link with your friends.
In order not to miss the release of new useful trading programs, add SURE FOREX TRADING to the friends list


本店最新上架
-
- MT4 MT5跟单EA 本地跟单远程跟单 绝不

- ¥1100.00
-
- 在MetaTrader市场购买MetaTrader 5的&#

- ¥3988.00
-
- 在MetaTrader市场购买MetaTrader 5的&#

- ¥3988.00
-
- 在MetaTrader市场购买MetaTrader 5的&#

- ¥3988.00
-
- 在MetaTrader市场购买MetaTrader 5的&#

- ¥3988.00
全网为您推荐
-
- AlgoTradeSoft

- ¥3988.00
-
- 国际期货套利软件

- ¥3988.00
-
- MT4 MT5跟单EA 本地跟单远程跟单 绝不
- ¥1100.00
-
- 在MetaTrader市场购买MetaTrader 5的&#
- ¥3988.00
-
- 在MetaTrader市场购买MetaTrader 5的&#
- ¥3988.00


