 客服热线:
 手机版
 二维码




































Trades Explore
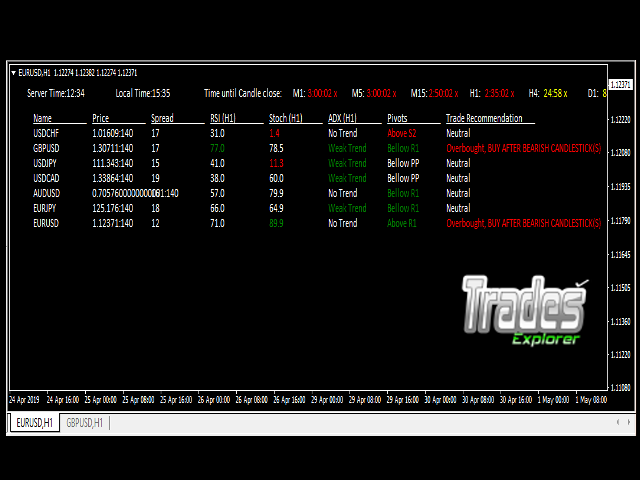
This is an indicator for trading any instruments. It helps traders to enter market reasonably and precisely. Very easy to use and can be customized to your own liking.
Who can use itAll types of traders. Be it:
- Trend Traders
- Swing Traders
- Scalpers
- News Trader
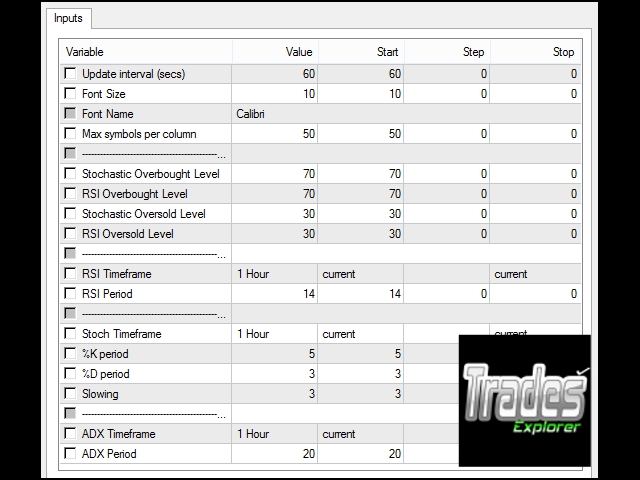
- Update Interval - Time in seconds for the indicator to update the reading on the information panel;
- Font size - size of font use in the texts in the information panel;
- Font Name - name of font use in the texts in the information panel;
- Maximum symbol per column - Maximum symbol to be displayed in a column in the information panel;
- Stochastic Overbought Level - Threshold level of Stochastic indicator to indicate overbought condition;
- RSI Overbought Level - Threshold level of Relative Strength Indicator to indicate overbought condition;
- Stochastic Oversold Level - Threshold level of Stochastic indicator to indicate oversold condition;
- RSI Oversold Level - Threshold level of Relative Strength Indicator to indicate oversold condition;
- RSI Timeframe - Timeframe for calculating RSI values;
- RSI Period - Period for calculating Relative Strength Indicator value;
- Stoch Timeframe - Timeframe for calculating Stochastic values;
- %K Period - %K Period of Stochastic indicator for calculating Stochastic values;
- %D Period - %D Period of Stochastic indicator for calculating Stochastic values;
- Slowing - Slowing of Stochastic indicator for calculating Stochastic values;
- ADX Timeframe - Timeframe for calculating Average Directional Movement Index values;
- ADX Period - Period for calculating Average Directional Movement Index value;
How to use the Indicator
Note that the indicator shows all the pairs in MARKET WATCH on the information panel.
- Drag and drop the indicator from the navigation section into any chart window.
- Use the default setting by clicking 'Ok' tab or use you own settings before clicking 'Ok' tab
- Wait for number of second set in the input parameter - Update Interval for the indicator to update itself
Buy Signal
- Check for a pair which shows Overbought under the column - Trade Recommendation
- Open the Chart window of the pair
- On the chart window, wait for BEARISH CANDLESTICK(S) FORMATION
- Enter buy position.
- Profit Target = Last swing High or use your own Profit Target
- Stop Loss = Last swing Low or use your own Stop Loss.
Sell Signal
- Check for a pair which shows Oversold under the column - Trade Recommendation
- Open the Chart window of the pair
- On the chart window, wait for BULLISH CANDLESTICK(S) FORMATION
- Enter sell position
- Profit Target = Last swing Low or use your own Profit Target
- Stop Loss = Last swing High or use your own Stop Loss
Send me message if you have any question.
本店最新上架
-
- MT4 MT5跟单EA 本地跟单远程跟单 绝不

- ¥1100.00
-
- 在MetaTrader市场购买MetaTrader 5的&#

- ¥3988.00
-
- 在MetaTrader市场购买MetaTrader 5的&#

- ¥3988.00
-
- 在MetaTrader市场购买MetaTrader 5的&#

- ¥3988.00
-
- 在MetaTrader市场购买MetaTrader 5的&#

- ¥3988.00
全网为您推荐
-
- AlgoTradeSoft

- ¥3988.00
-
- 国际期货套利软件

- ¥3988.00
-
- MT4 MT5跟单EA 本地跟单远程跟单 绝不
- ¥1100.00
-
- 在MetaTrader市场购买MetaTrader 5的&#
- ¥3988.00
-
- 在MetaTrader市场购买MetaTrader 5的&#
- ¥3988.00


