 客服热线:
 手机版
 二维码




































Strong Trend Flat Signal
The principle of the indicator.
The Strong Trend Flat Signal (STFS) indicator is the intersection of two, developed by the author, non-lagging moving averages with averaging periods 21 and 63.
A simple moving average (SMA) with an averaging period (2n + 1) of bars is always obtained lagging by n bars. If SMA or other types of moving averages are the basis for making trading decisions, then their strong delay does not allow to open positions in time and close positions, which leads to losses.
Non-lagging moving averages calculated at the points (Inf, n + 1) in the usual way, and at the points of the [n, 0] segment, where 0 is the last bar number, is algorithmically and there is a curvilinear sector (cover out the confidence interval) in which the line of the non-lagging moving average fits with the confidence level specified in the indicator settings. It is clear that the more the confidence probability value is taken (which by default is equal to 0.67), the wider the curvilinear sector of the confidence interval is obtained. If we take the confidence probability equal to zero, then the sector of the indicator readings at points [n, 0] will shrink to a curve, which will pass through the most probable values of the non-lagging average. Statistical studies show that the price around the non-remaining average is distributed according to the Laplace law. Knowledge of the distribution law and the algorithm for calculating the most likely non-lagging average on the [n, 0] segment allow us to calculate the confidence interval sector.
Trade
using the Strong Trend Flat Signal
indicator.
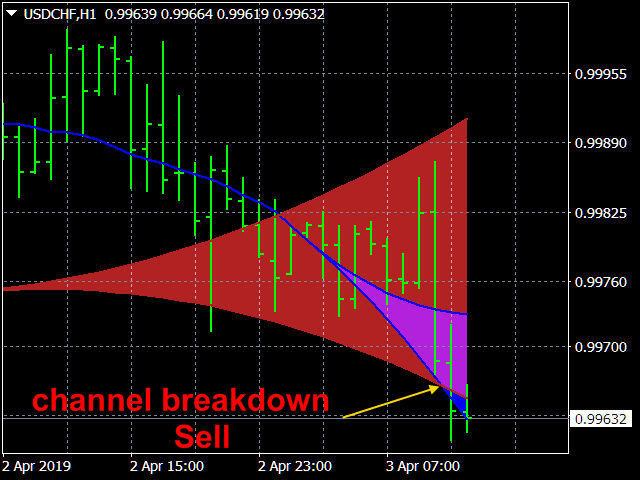
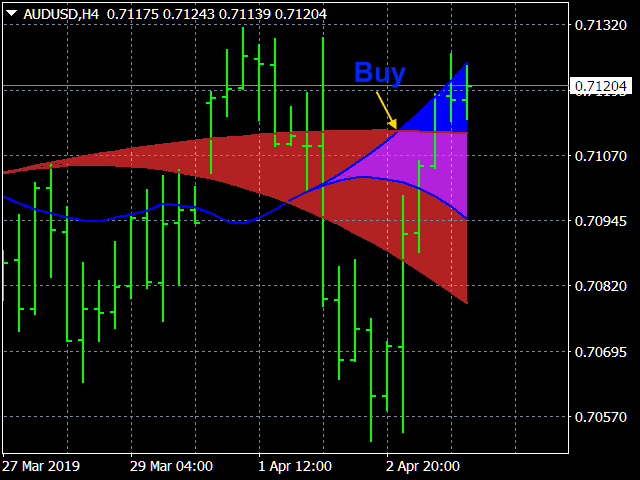
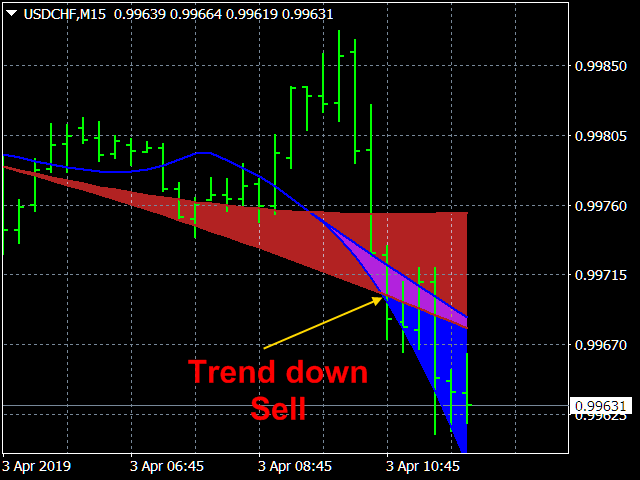
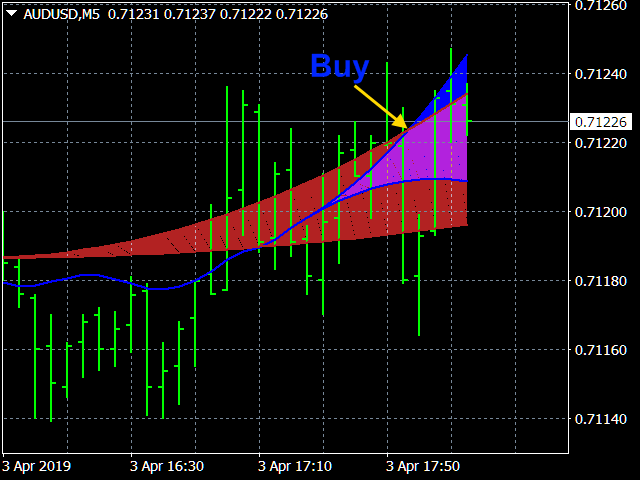
If the lower border slow component of the figure sector of the STFS indicator moves to the up, then there is an uptrend and you need to open positions on Buy. If the upper boundary of the slow component of the curvilinear sector of the STFS indicator is oriented downwards, then there is a downward trend and you need to open positions on Sell. In such cases, you can be sure of the correctness of the established trend direction with the confidence level set in the indicator settings.
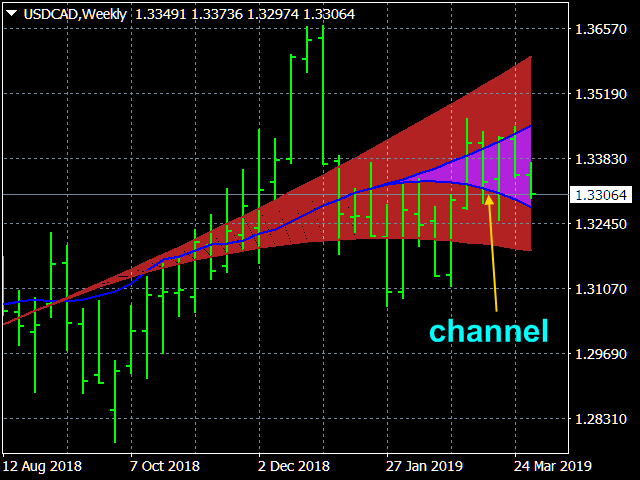
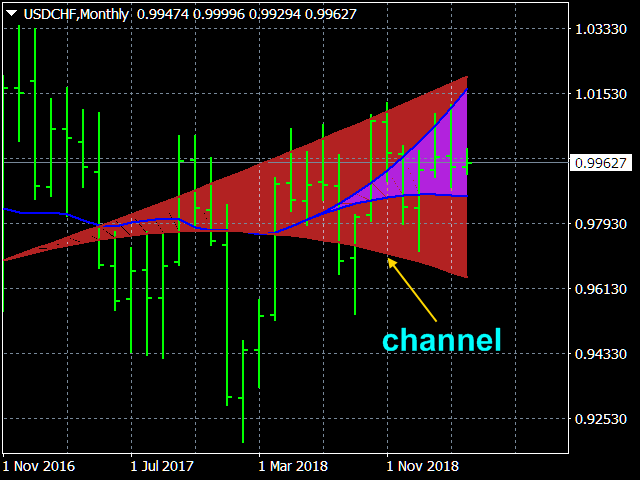
If the upper limit of the slow component of the figure sector of the STFS indicator moves to the up, and the its lower limit moves down, then there is a flat, which serves as a signal for closing trend positions.
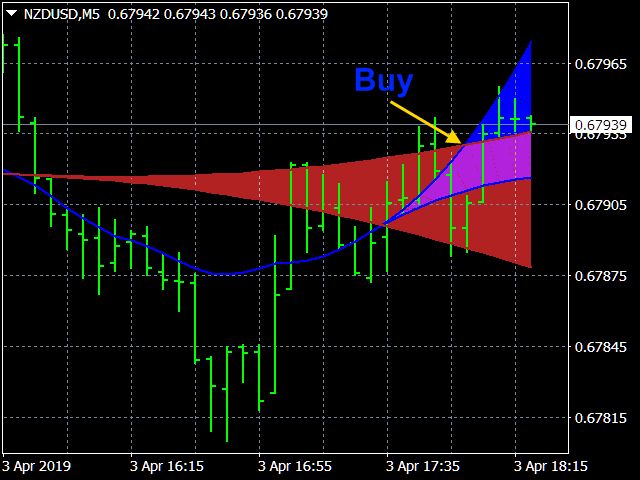
If the slow component of the indicator determines the flat or channel, but the sector of the fast component is noticeably beyond the sector of the slow component, then this means the breakdown of the channel and serves as a signal to open the corresponding position.
If the slow component of the indicator determines the trend, but the sector of the fast component noticeably leaves the sector of the slow component from the opposite direction of the trend, this means the end of the trend and serves as the signal to close the corresponding position.
Indicator settings.
- Price type - applied price. Values: Close price, Open price, High price, Low price, Median price ((high + low)/2 - default), Typical price ((high + low + close)/3), Weighted price ((high + low + 2*close)/4).
- The averaging method - Values: Simple (default), Exponential, Smoothed, Linear weighted.
- The first averaging period - Any integer (21 by default).
- The second averaging period - Any integer (63 by default).
- Confidence probability - Values: from 0 to 0.999 (0.67 by default).
- Global shift - Global shift of the beginning of the indicator readings in bars. Values: any positive integer (0 default).
- Color of the first line. – The color of the indicator first line and its figure sector.
- Color of the second line. – The color of the indicator second line and its figure sector.
- Paint over the confidence interval? - Values: true (by default), false.
本店最新上架
-
- MT4 MT5跟单EA 本地跟单远程跟单 绝不

- ¥1100.00
-
- 在MetaTrader市场购买MetaTrader 5的&#

- ¥3988.00
-
- 在MetaTrader市场购买MetaTrader 5的&#

- ¥3988.00
-
- 在MetaTrader市场购买MetaTrader 5的&#

- ¥3988.00
-
- 在MetaTrader市场购买MetaTrader 5的&#

- ¥3988.00
全网为您推荐
-
- AlgoTradeSoft

- ¥3988.00
-
- 国际期货套利软件

- ¥3988.00
-
- MT4 MT5跟单EA 本地跟单远程跟单 绝不
- ¥1100.00
-
- 在MetaTrader市场购买MetaTrader 5的&#
- ¥3988.00
-
- 在MetaTrader市场购买MetaTrader 5的&#
- ¥3988.00


