客服热线:
 手机版
 二维码






























Stock Indices Drawdown Indicator
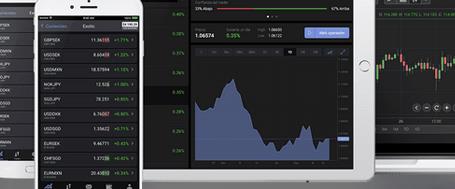
This indicator is useful to get a quick overview of the market if you are interested in the current status of stock indices around the world (or other trading instruments). For example, you can also quickly see how small caps (US2000) are performing compared to large caps (US30). The given drawdown might help to decide when to enter into the market, for example if you are interested in long-term buy-and-hold strategies.
The default settings are based on IC Markets symbols. For other brokers you probably have to change them.
It will display a table for a given list of symbols with 3 columns:
- Daily percentage change.
- Drawdown from the highest point of the given history in percent.
- CAGR (Compound Annual Growth Rate) in percent for the last X years calculated from the current price to a 50 week moving average X years ago (if the broker provides that data).
If the values are not showing correctly, it might be necessary to open a D1 and W1 chart for every symbol to force MT4 to load the historic data. only open it once and close it again afterwards.
Parameters

本店最新上架
-
- MT4 MT5跟单EA 本地跟单远程跟单 绝不

- ¥1100.00
-
- 在MetaTrader市场购买MetaTrader 5的&#
- ¥3988.00
-
- 在MetaTrader市场购买MetaTrader 5的&#
- ¥3988.00
-
- 在MetaTrader市场购买MetaTrader 5的&#
- ¥3988.00
-
- 在MetaTrader市场购买MetaTrader 5的&#
- ¥3988.00
全网为您推荐
-
- AlgoTradeSoft

- ¥3988.00
-
- 国际期货套利软件

- ¥3988.00
-
- MT4 MT5跟单EA 本地跟单远程跟单 绝不
- ¥1100.00
-
- 在MetaTrader市场购买MetaTrader 5的&#
- ¥3988.00
-
- 在MetaTrader市场购买MetaTrader 5的&#
- ¥3988.00