客服热线:
 手机版
 二维码






























Multi time frame 4D RSI
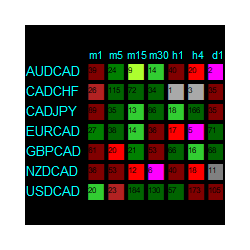
with this 4 dimensional RSI indicator you can visually get informed if there is any overbought or oversold situation in any time-frames and any currency-pairs you desire.
it has been designed based on overbought and oversold strategy. when RSI line cross down overbought level ,it might be a sell signal and the indicator will show this with a red square and when RSI line cross up the oversold level it might be a buy signal in the corresponding time frame and the indicator will show that with a green square.
numbers in the squares show the number of candles passed from cross-up or cross-down .
if RSI is absolutely in the overbought or oversold area , the corresponding square will be displayed in gray .
if buy signal is new it will be displayed in light green and if there is so many candles passed from the signal , the corresponding square will be displayed in dark green. and so for sell signal.


本店最新上架
-
- MT4 MT5跟单EA 本地跟单远程跟单 绝不

- ¥1100.00
-
- 在MetaTrader市场购买MetaTrader 5的&#
- ¥3988.00
-
- 在MetaTrader市场购买MetaTrader 5的&#
- ¥3988.00
-
- 在MetaTrader市场购买MetaTrader 5的&#
- ¥3988.00
-
- 在MetaTrader市场购买MetaTrader 5的&#

- ¥3988.00
全网为您推荐
-
- AlgoTradeSoft

- ¥3988.00
-
- 国际期货套利软件

- ¥3988.00
-
- MT4 MT5跟单EA 本地跟单远程跟单 绝不
- ¥1100.00
-
- 在MetaTrader市场购买MetaTrader 5的&#
- ¥3988.00
-
- 在MetaTrader市场购买MetaTrader 5的&#
- ¥3988.00