 客服热线:
 手机版
 二维码




































MESA Spectrum
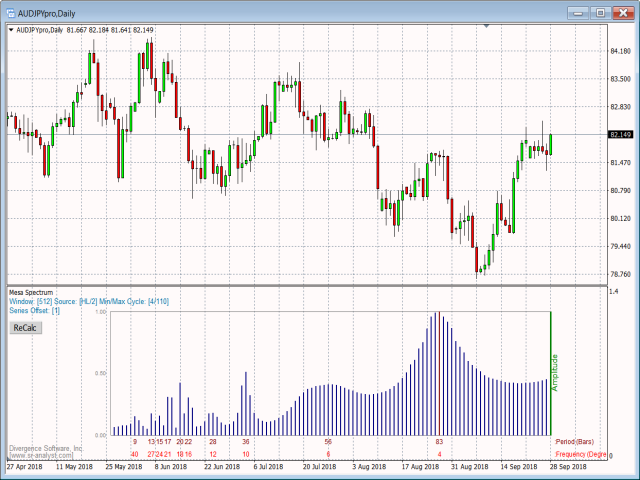
The MESA Spectrum indicator calculates the power spectrum of a data series using the Maximum Entropy Spectrum Estimation method and produces a power spectrum plot. The Maximum Entropy algorithm, unlike a simple FFT transform, will include frequencies from the entire complex frequency plane and not just the Nyquist interval which, in general terms, means that it can resolve cycle periods that are larger than the data window passed to the function. In addition, MESA has the ability to fit very sharp spectral features which are often missed by other analysis methods.
The displayed power spectrum will highlight the dominant cycles and frequencies within the data and will display the Period and Frequency below each peak.
Prior to being passed to the MESA algorithm, the log of the price data is detrended using a least means squared filter.
If you experiment with this tool, you will quickly find that most financial time series have their highest amplitudes at the low end of the frequency spectrum and most of these 'dominant' cycles are too long to be used for short-term trading. The script has two display filters that can be applied (Upper Cycle Limit and Lower Cycle Limit) where you can input an upper and lower cycle period boundary. This allows you to effectively ignore the very high and/or very low frequencies so that you can concentrate on finding cycles within in a period range that makes sense for your trading style. In addition, you can select the Window size for the cycle analysis, set the input price source, and specify the input data offset.
Periods are calculated as the number of bars required to complete a cycle and frequencies are calculated as the number of degrees of change per bar.
P = Bars per Cycle;
F = 360/P (360-degrees divided by period)
An alternative F value can be calculated as number of cycles in the data period N:
F = N/P.
The spectral information can be used as the basis for additional cycle study work or it can be used to fine-tune various oscillators and indicators. The typical approach is to use the Power Spectrum to identify the dominant cycle in your data and then set your moving average or oscillator to a period that is 1/2 of the dominant cycle.
Options:
| Menu Option | Description |
|---|---|
| Window Size | Select from 1024, 512, 256, or 128. Generally the 512 or 256 window size is recommended. The default is 512. |
| Source | Select the price input source. The default is Median Price. |
| Data Offset | Set the offset into the price series. The default is 1 (bar). |
| Upper Cycle Limit | Select the largest acceptable cycle length. The default is 110. Range is 1-512. |
| Lower Cycle Limit | Select the smallest acceptable cycle length. The default is 4. Range is 1-512. |
| Spectrum (reg) Color | Set the color for the spectrum plot. |
| Spectrum (max) Color | Set the color to highlight the dominant cycle. |
| Spectrum (frame) Color | Set the color for the spectrum frame. |
| Spectrum Legend 1 Color | Set the color for the Period legend. |
| Spectrum Legend 2 Color | Set the color for the Frequency legend. |
| Info Box Color | Set the color for the information box displayed below the title. |


本店最新上架
-
- MT4 MT5跟单EA 本地跟单远程跟单 绝不

- ¥1100.00
-
- 在MetaTrader市场购买MetaTrader 5的&#

- ¥3988.00
-
- 在MetaTrader市场购买MetaTrader 5的&#

- ¥3988.00
-
- 在MetaTrader市场购买MetaTrader 5的&#

- ¥3988.00
-
- 在MetaTrader市场购买MetaTrader 5的&#

- ¥3988.00
全网为您推荐
-
- AlgoTradeSoft

- ¥3988.00
-
- 国际期货套利软件

- ¥3988.00
-
- MT4 MT5跟单EA 本地跟单远程跟单 绝不
- ¥1100.00
-
- 在MetaTrader市场购买MetaTrader 5的&#
- ¥3988.00
-
- 在MetaTrader市场购买MetaTrader 5的&#
- ¥3988.00


