 客服热线:
 手机版
 二维码




































Spread Record Analyzer
This indicator is a utility that can output spreads to CSV file in three formats.
In the case of scalping where the spread greatly affects the trade result, the specification of the spread of the FX Broker you use is an important point to be aware of. Since the spread value changes greatly depending on the time zone, the average value of spreads officially announced by FX Broker is not very helpful. It is very important to investigate the spread specification of each FX Brokers by yourself. This indicator is useful for such users.
Description of CSV file
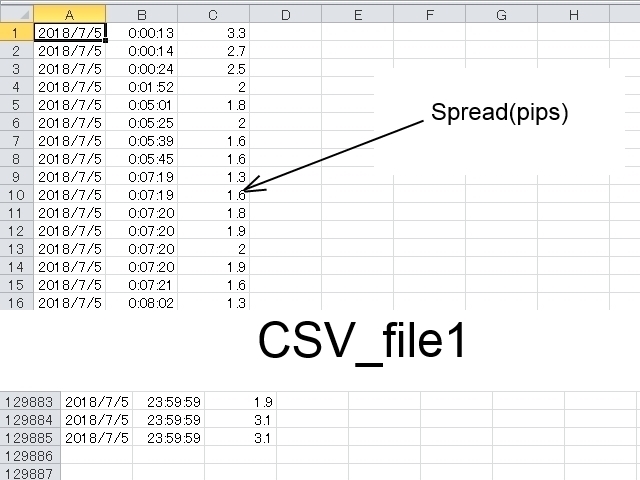
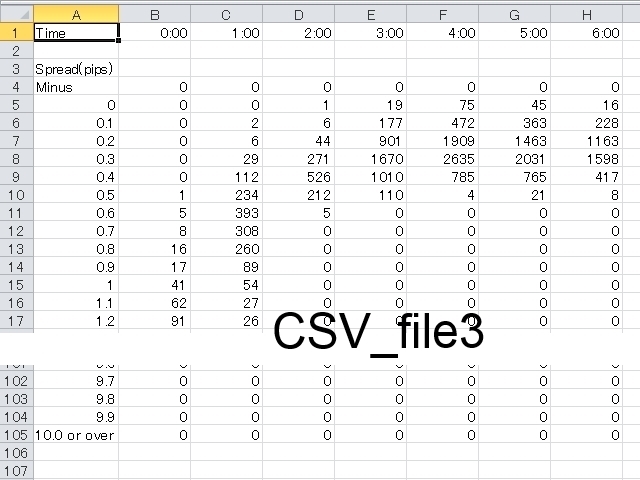
The CSV file is created in the folder (./MQL4/Files/ ). However, in the case of a test using a tester, it is created in the folder (./tester/files/ ). Refer to the screenshot for the format specification of the CSV file.
- CSV_file1: Spreads are output every tick. "YYYY/MM/DD", "HH:MI:SS", "Spread(pips)"
- CSV_file2: Outputs the average, maximum and minimum spread of spreads per timeframe. "YYYY/MM/DD", "HH:MI", "Average Spread(pips)", "Maximum Spread(pips)", "Minimum Spread(pips)"
- CSV_file3: Histogram is output for each timeframe and it shows how many iterations have been done for each spread value. Each count in increments of 0.1 pips from 0.0 pips to 9.9 pips. And counting of negative spreads and counting above 10.0 pips.
Setting parameters
- Copyright - Do not change "Copyright".
- Recording_start_time - It is the recording start time. Set in "YYYY / MM / DD HH: MI: SS" format. Set it by server time instead of PC local time.
- Recording_end_time - It is the recording end time. Set in "YYYY / MM / DD HH: MI: SS" format. Recording is possible up to 86,400 seconds (= 1 day).
- CSV_file1 - When set to "true", CSV_file1 is output.
- CSV_file2 - When set to "true", CSV_file2 is output.
- CSV_file3 - When set to "true", CSV_file3 is output.
- CSV_file1_name - Set the file name of CSV_file1.
- CSV_file2_name - Set the file name of CSV_file2.
- CSV_file3_name - Set the file name of CSV_file3.
- Delimiter - Set only one character of arbitrary character. However, the escape sequence can not be used. The initial value is a comma (","). If "Delimiter" is omitted, the delimiter is treated as a horizontal tab("t").
- Color - Set the color of the message displayed in the upper right of the chart window.
How to Use
- Display the chart of the currency pair you want to record and choose an arbitrary timeframe. Units (CSV_file 2, CSV_file 3) to be output differs depending on the timeframe selection. The recommended time is 1 hour bars.
- Insert this indicator (Spread_Record_Analyzer.ex4).
- Set start and end of recording time and set the switch of CSV of the type you want to output to "true". Other parameters can also be changed if necessary.
- When the status becomes "Waiting", "Recording", and "Completed", output to the CSV file is complete.
Information on the chart window
- Status: - The status is displayed.
- "Stopped" - It is in a stopped state. Recording will never be started.
- "Waiting(XXXX[s])" - The time until recording start is counted down.
- "Recording(XX[%])" - Recording is in progress. Progress is displayed as a percentage.
- "Completed" - It means completion of recording.
- Current Spread(pips): - It is the current value of the spread which fluctuates in real time.
- Average Spread(pips) within Recording Period: - The average spread of the period from the start to the end of the recording.
- Maximum Spread(pips) within Recording Period: - The maximum spread of the period from the start to the end of the recording.
- Minimum Spread(pips) within Recording Period: - The minimum spread of the period from the start to the end of the recording.
Indicator displayed in subwindow
The indication of the indicator displayed in the subwindow will continue to display the average, maximum and minimum spread of each timeframe.
- Line(Lime) - Average spread.
- Line(Red) - Maximum spread.
- Line(DodgerBlue) - Minimum spread.
Notes
- You can open multiple chart windows and insert this indicator at the same time, but if CSV_file has duplicate file names, change the file name so that it does not overlap.
- If "Recording_end_time" is set to Friday's market closing time, recording will not be completed at the end of Friday. In this case, recording will be completed at the beginning of Monday. be careful.



本店最新上架
-
- MT4 MT5跟单EA 本地跟单远程跟单 绝不

- ¥1100.00
-
- 在MetaTrader市场购买MetaTrader 5的&#

- ¥3988.00
-
- 在MetaTrader市场购买MetaTrader 5的&#

- ¥3988.00
-
- 在MetaTrader市场购买MetaTrader 5的&#

- ¥3988.00
-
- 在MetaTrader市场购买MetaTrader 5的&#

- ¥3988.00
全网为您推荐
-
- AlgoTradeSoft

- ¥3988.00
-
- 国际期货套利软件

- ¥3988.00
-
- MT4 MT5跟单EA 本地跟单远程跟单 绝不
- ¥1100.00
-
- 在MetaTrader市场购买MetaTrader 5的&#
- ¥3988.00
-
- 在MetaTrader市场购买MetaTrader 5的&#
- ¥3988.00


